
数据处理-拉伸中的strain-stress曲线
目录基本步骤软件推荐代码部分草图输出主要记录科研中遇到的通用数据处理过程源代码下载:Deformation of Amorphous Polyethylene,不过里面的data不是以文件形式提供的,不太方便。所以可以从我的资源里下载:deformTest.tar.gz,里面含有基本的源数据和对应的处理py脚本。基本步骤得到数据文件(来源于各种仿真程序,通常可以导致指定格式的文件。批量读取文件的话
·
主要记录科研中遇到的通用数据处理过程
源代码下载:Deformation of Amorphous Polyethylene,不过里面的data不是以文件形式提供的,不太方便。
所以可以从我的资源里下载:deformTest.tar.gz,里面含有基本的源数据和对应的处理py脚本。
基本步骤
- 得到数据文件(来源于各种仿真程序,通常可以导致指定格式的文件。批量读取文件的话,需要考虑到文件夹内文件的排序以及文件类型问题)
- 得到文件中的数据(读取上述文件中的数据,需要考虑到数据的筛选清洗、以及时间步的平均调整)
- 对数据进行可视化(哪怕excel都可以做出好看的图,只是综合来看可以完成以上步骤的同时还需要可视化,建议使用一门编程语言,例如Python)
软件推荐
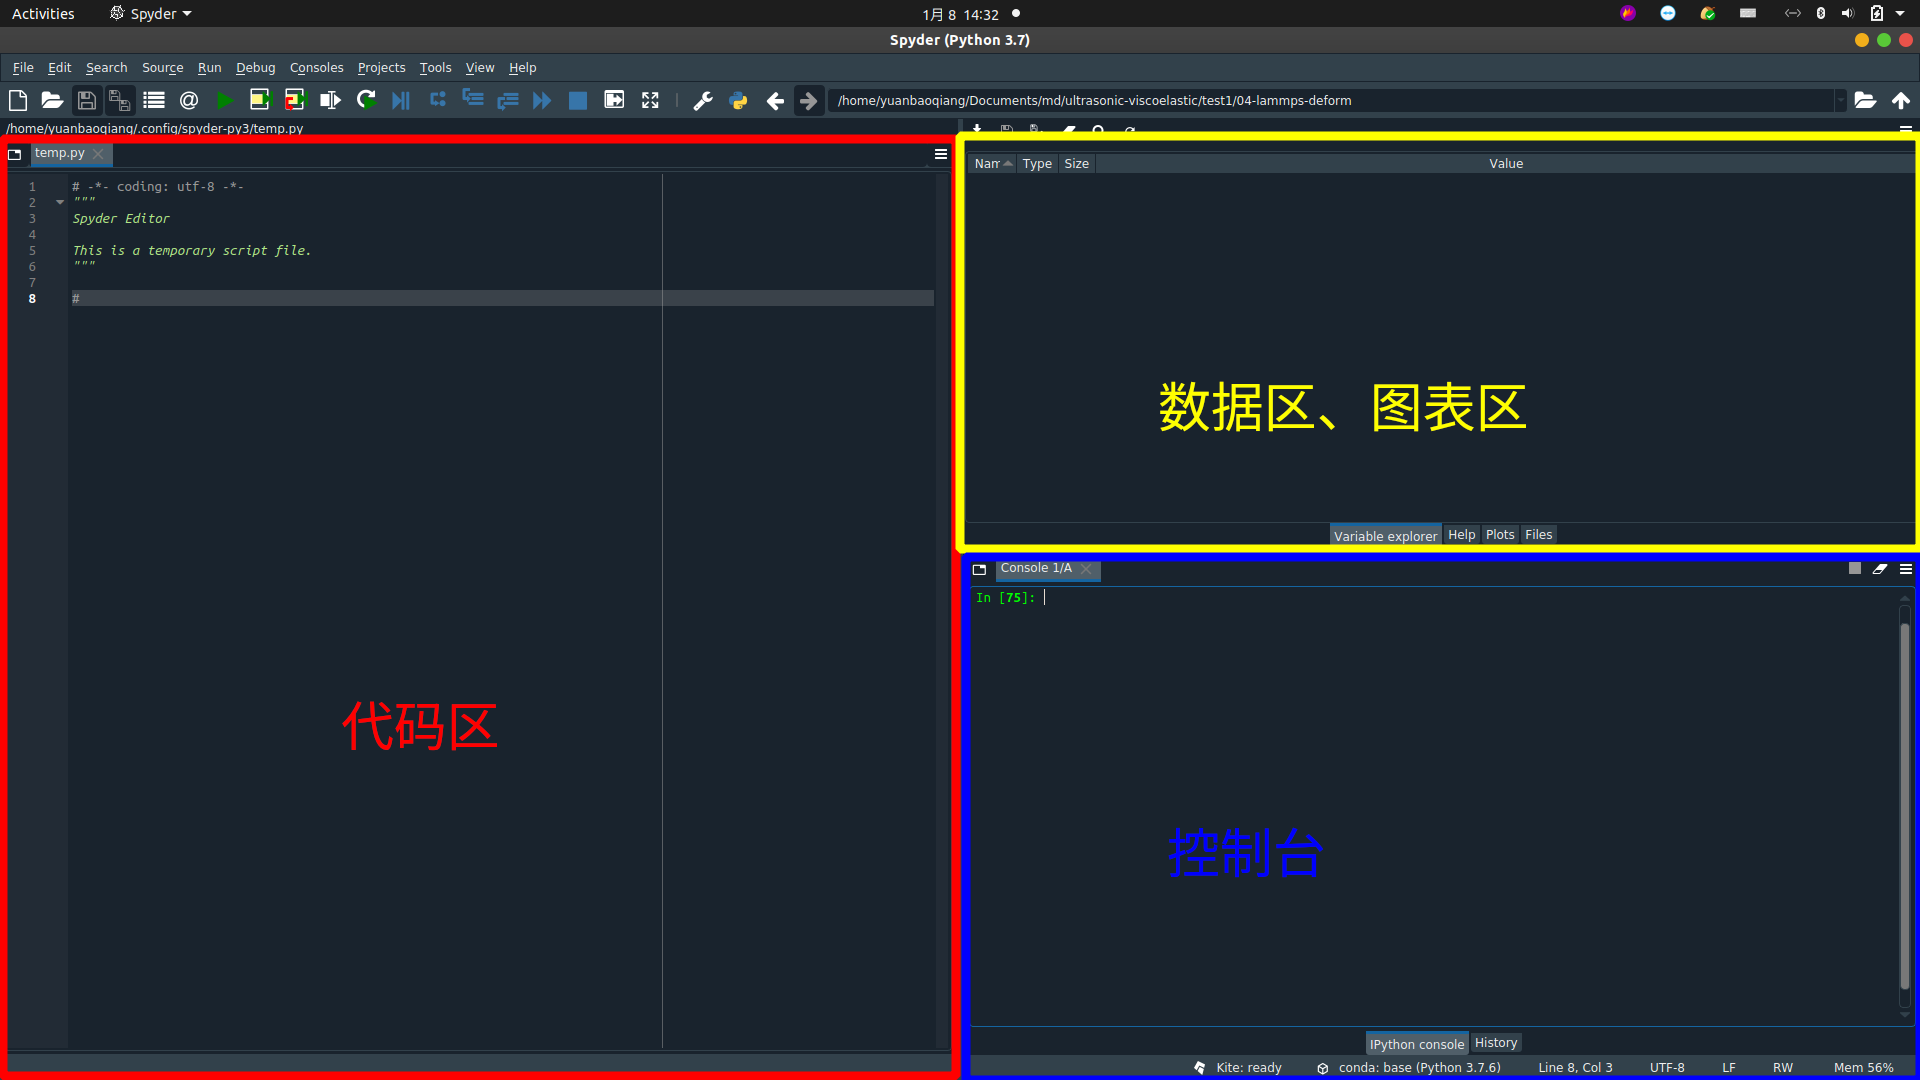
IDE部分建议使用Spyder,界面和Matlab类似。
代码部分
#!/usr/bin/env python3
# -*- coding: utf-8 -*-
"""
Created on Fri Jan 8 12:37:24 2021
@author: yuanbaoqiang
This is a simple py to handle the data in multi txt files, mainly including three steps:
1. ENSURE YOUR DATA FILES
2. OBTAIN YOUR DATA
3. PLOT
"""
# Import modules you need to deal with your files
# glob,os ---> file processing
import glob,os
# pandas ----> data processing
import pandas as pd
# matplotlib ----> plot
import matplotlib.pyplot as plt
########################################################
# 1. FIND THE PATH, AND LOAD NEEDED FILES IN THIS PATH
# To get the py file's absolute path
path=os.getcwd()
# Add all .txt files in the path above
file=glob.glob(os.path.join("*.txt"))
# Sort all .txt files you have added
file.sort()
# You can also sort all files by using the keyword in your file name with the lamba experession below
# file.sort(key = lambda x: int(x[13:-4]))
print('You have added ' + str(len(file)) + ' files, and they are ' + str(file))
# Define a empty list
# List named "df" is to store your data in every file seperately in a dataframe element
df = []
# List named "names" is to define column names of every dataframe
names = []
names1 = ['strain', 'pxx', 'pyy', 'pzz', 'lx', 'ly', 'lz' , 'temp'];
names2 = ['strain', 'epair', 'ebond', 'eangle', 'edihed']
names.append(names1)
names.append(names2)
########################################################
# 2. OBTAIN THE DATA IN FILES YOU HAVE LOADED
# Traverse the list and obtain the needed frame in each file
i = 0
for f in file:
# Official interpretation about "pandas.read_csv", which is the most "read" command I have used
# https://pandas.pydata.org/pandas-docs/stable/reference/api/pandas.read_csv.html
df.append(pd.read_csv(f, delim_whitespace=True, names=names[i], skiprows=[0]))
i = i + 1
########################################################
# 3. JUST PLOT USING THE DATA YOU NEEDED
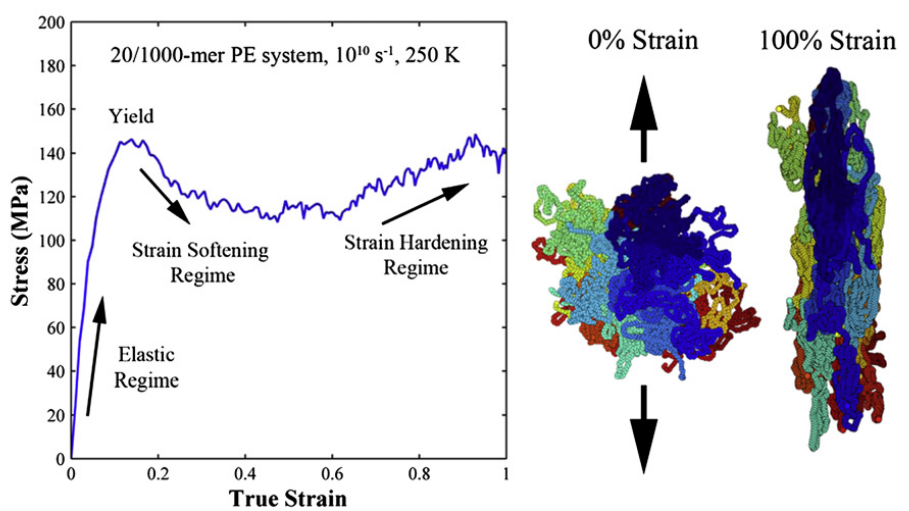
# Plot a simple graph, and you can see a rough prototype like the "strain-stress" curve in the paper:
# 10.1016/j.polymer.2010.10.009
plt.plot(df[0][:]['strain'], df[0][:]['pxx'])
草图输出
不含数据的处理,只是一个基本草图输出,但从趋势来看是和论文大致相同的。


10.1016/j.polymer.2010.10.009论文中的图:
福利
本群在lammps学习过程中给予了我莫大的帮助,群里很活跃,欢迎小伙伴的加入~
欢迎加入qq群:698671585
欢迎关注群主的公众号,lammps_zhushou,文章持续更新中~

一站式 AI 云服务平台
更多推荐


 0
0 0
0- 0


 已为社区贡献2条内容

所有评论(0)