
ESP32-S3 JTAG Debugging User Guide
## 1 The ESP32-S3 support use theorfor JTAG debugging. For more instructions,please read the “ESP32-S3 JTAG Debugging ”guide.For windows ,You can use “ESP-IDF Tools Installer ” toinstall ESP-IDF SDK E
1、Introduce
The ESP32-S3 support use the JTAG pins or USB pins for JTAG debugging. For more instructions,please read the “ESP32-S3 JTAG Debugging ”guide.
2、Hardware Instructions
2.1 JTAG Pins for Debugging
- The ESP32-S3 JTAG pins are GPIO39~GPIO42, please read the "ESP32-S3 pins and JTAG signals " instructions.
For debugging with JTAG pins, you need to use the ESP-PROG tool.
| ESP32-S3 Pin | JTAG Signal |
|---|---|
MTDO / GPIO40 |
TDO |
MTDI / GPIO41 |
TDI |
MTCK / GPIO39 |
TCK |
MTMS / GPIO42 |
TMS |
Please Note :
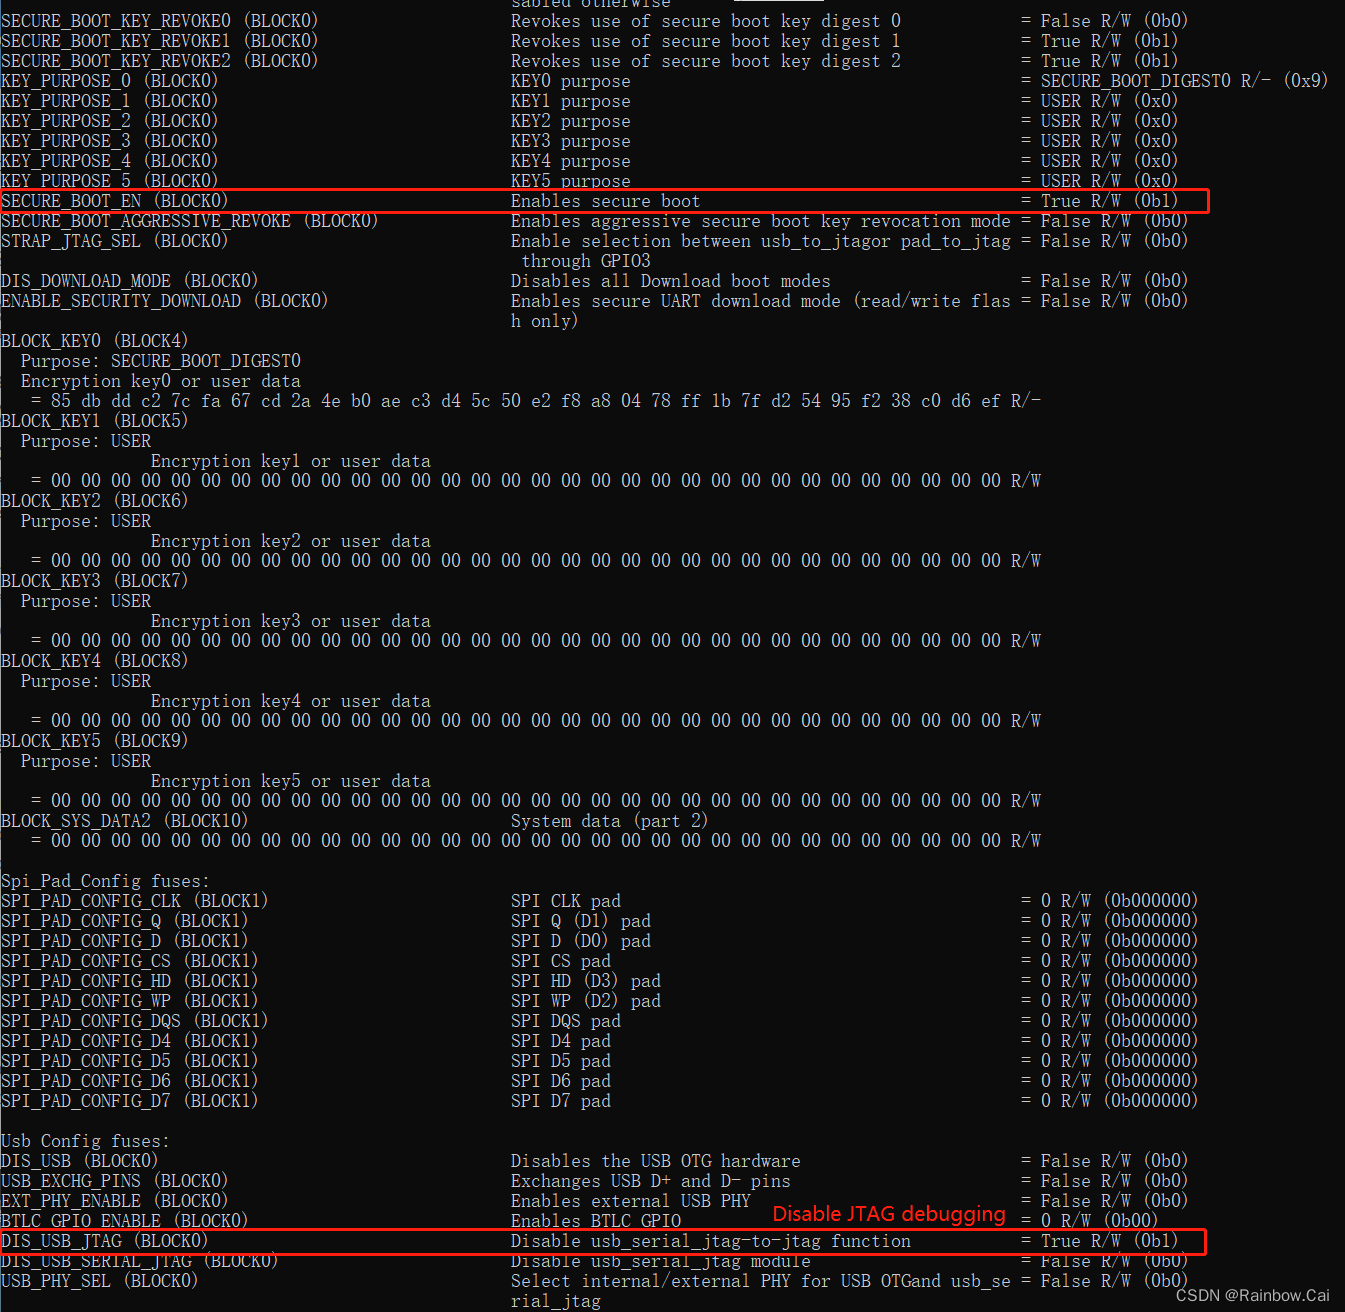
- By default, after
enable Flash Encryptionand/orSecure Boot, It is willdisabled the USB JTAG debuggingfunction, butnot disabledthe USB host and USB device function. Please read the “JTAG with Flash Encryption or Secure Boot” or “JTAG Debugging” instructions
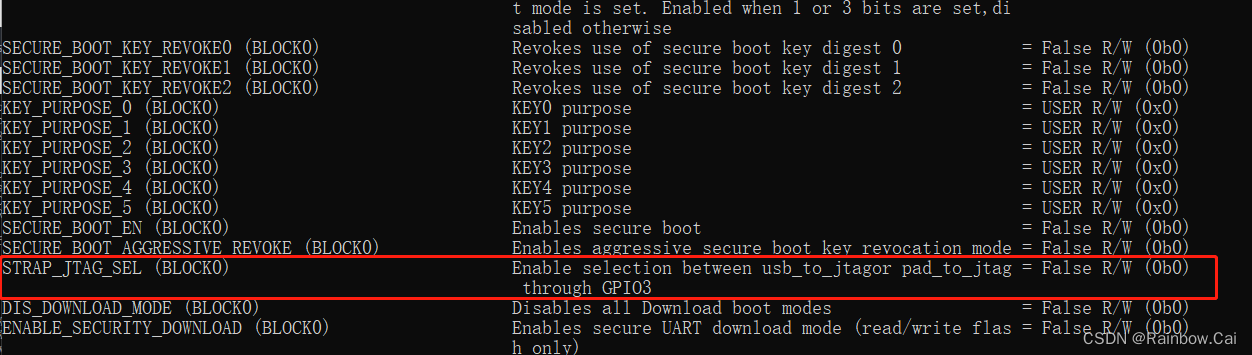
- If you need to use the JTAG pins for debugging, First, you need to set the
STRAP_JTAG_SELto ‘1’ in eFuse , and then theGPIO3needs to be pulled down.
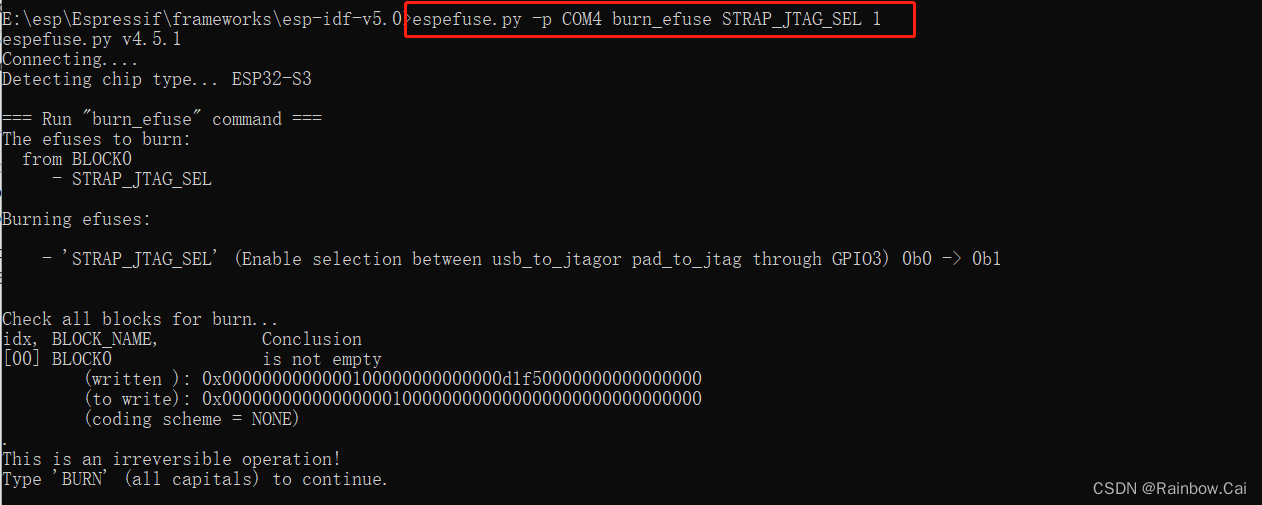
- Write the eFuse
STRAP_JTAG_SELcommand
espefuse.py -p COM4 burn_efuse STRAP_JTAG_SEL 1
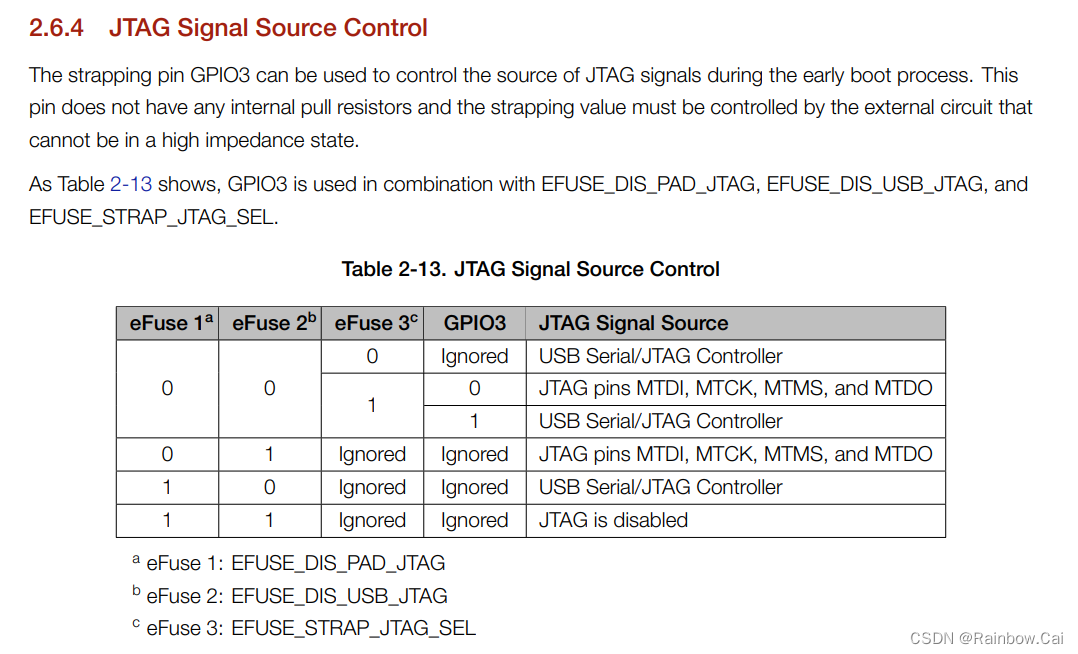
- Please refer to the 《ESP32-S3 Datasheet》 about the
"Table 2-13. JTAG Signal Source Control"instructions. As follows :
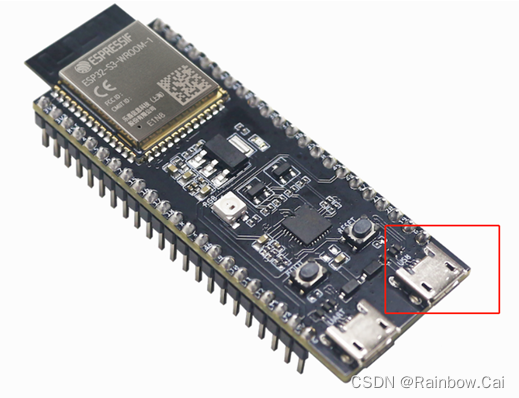
2.2 USB Pins for Debugging
If you need to use the USB pins for debugging,the
GPIO3can befloat.
- ESP32-S3 has a built-in JTAG circuitry and can be debugged without any additional chip. Only an USB cable connected to the D+/D- pins is necessary. The necessary connections are shown in the following section. Please read the "Configure ESP32-S3 built-in JTAG Interface " instructions.
ESP32-S3 Pin |
USB Signal |
|---|---|
| GPIO19 | D- |
| GPIO20 | D+ |
| 5V | V_BUS |
| GND | Ground |
3、Debugging Environment Preparation
3.1 The Software Environment
- The esp-idf SDK software
compilation environmentOpenOCDenvironmentGDBcommand environment
- Before debugging , please set up the esp-idf SDK software environment. please refer to the "ESP-IDF Programming Guide " .The ESP32-S3 only supports release/v4.4 and later version of the ESP-IDF SDK. Please refer to the “ESP-IDF Release and SoC Compatibility” instructions.
The software development environment we recommend to you is the simplest.
-
For windows ,You can use “ESP-IDF Tools Installer ” to install ESP-IDF SDK Environment . Please refer to the “Set up the ESP-IDF SDK compilation environment + Visual Studio Code software programming environment” guide.
-
For Ubuntu(We recommend) , Please read "Standard Setup of Toolchain for Linux " instructions. You can also refer to the “How to set up the software development environment ESP-IDF for ESP32-S3” guide.
-
The esp-idf software compilation environment integrates the ‘OpenOCD Environment’ and ‘
GDB Environment’ required for software debugging.
3.2 The Hardware Preparation
-
If you are using the JTAG pins for Debugging, You can use our ESP32-S3-DevKitC-1 board and ESP-PROG tool for testing.
-
If you are using the USB pins for Debugging, You can use our ESP32-S3-DevKitC-1 board USB port for testing diectly!
4、Debugging Steps
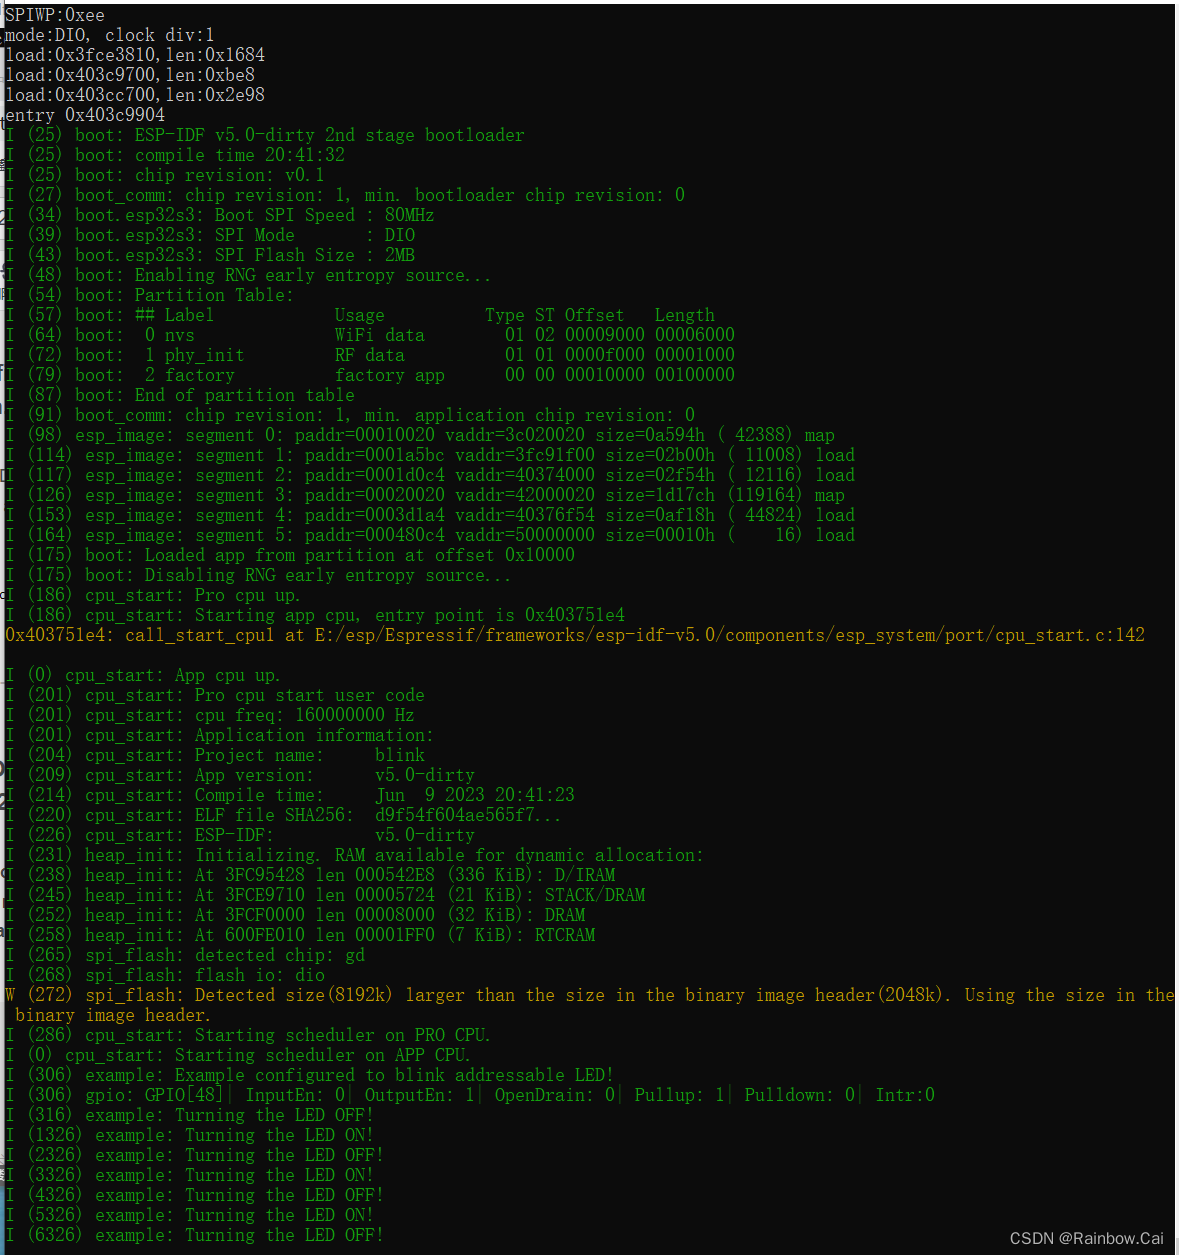
4.1 Flash the firmware
- Under the esp-idf SDK compilation environment, please use the UART0 pins and running the following command to
download the firmwareandview the firmware running log.
idf.py -p COM4 flash monitor
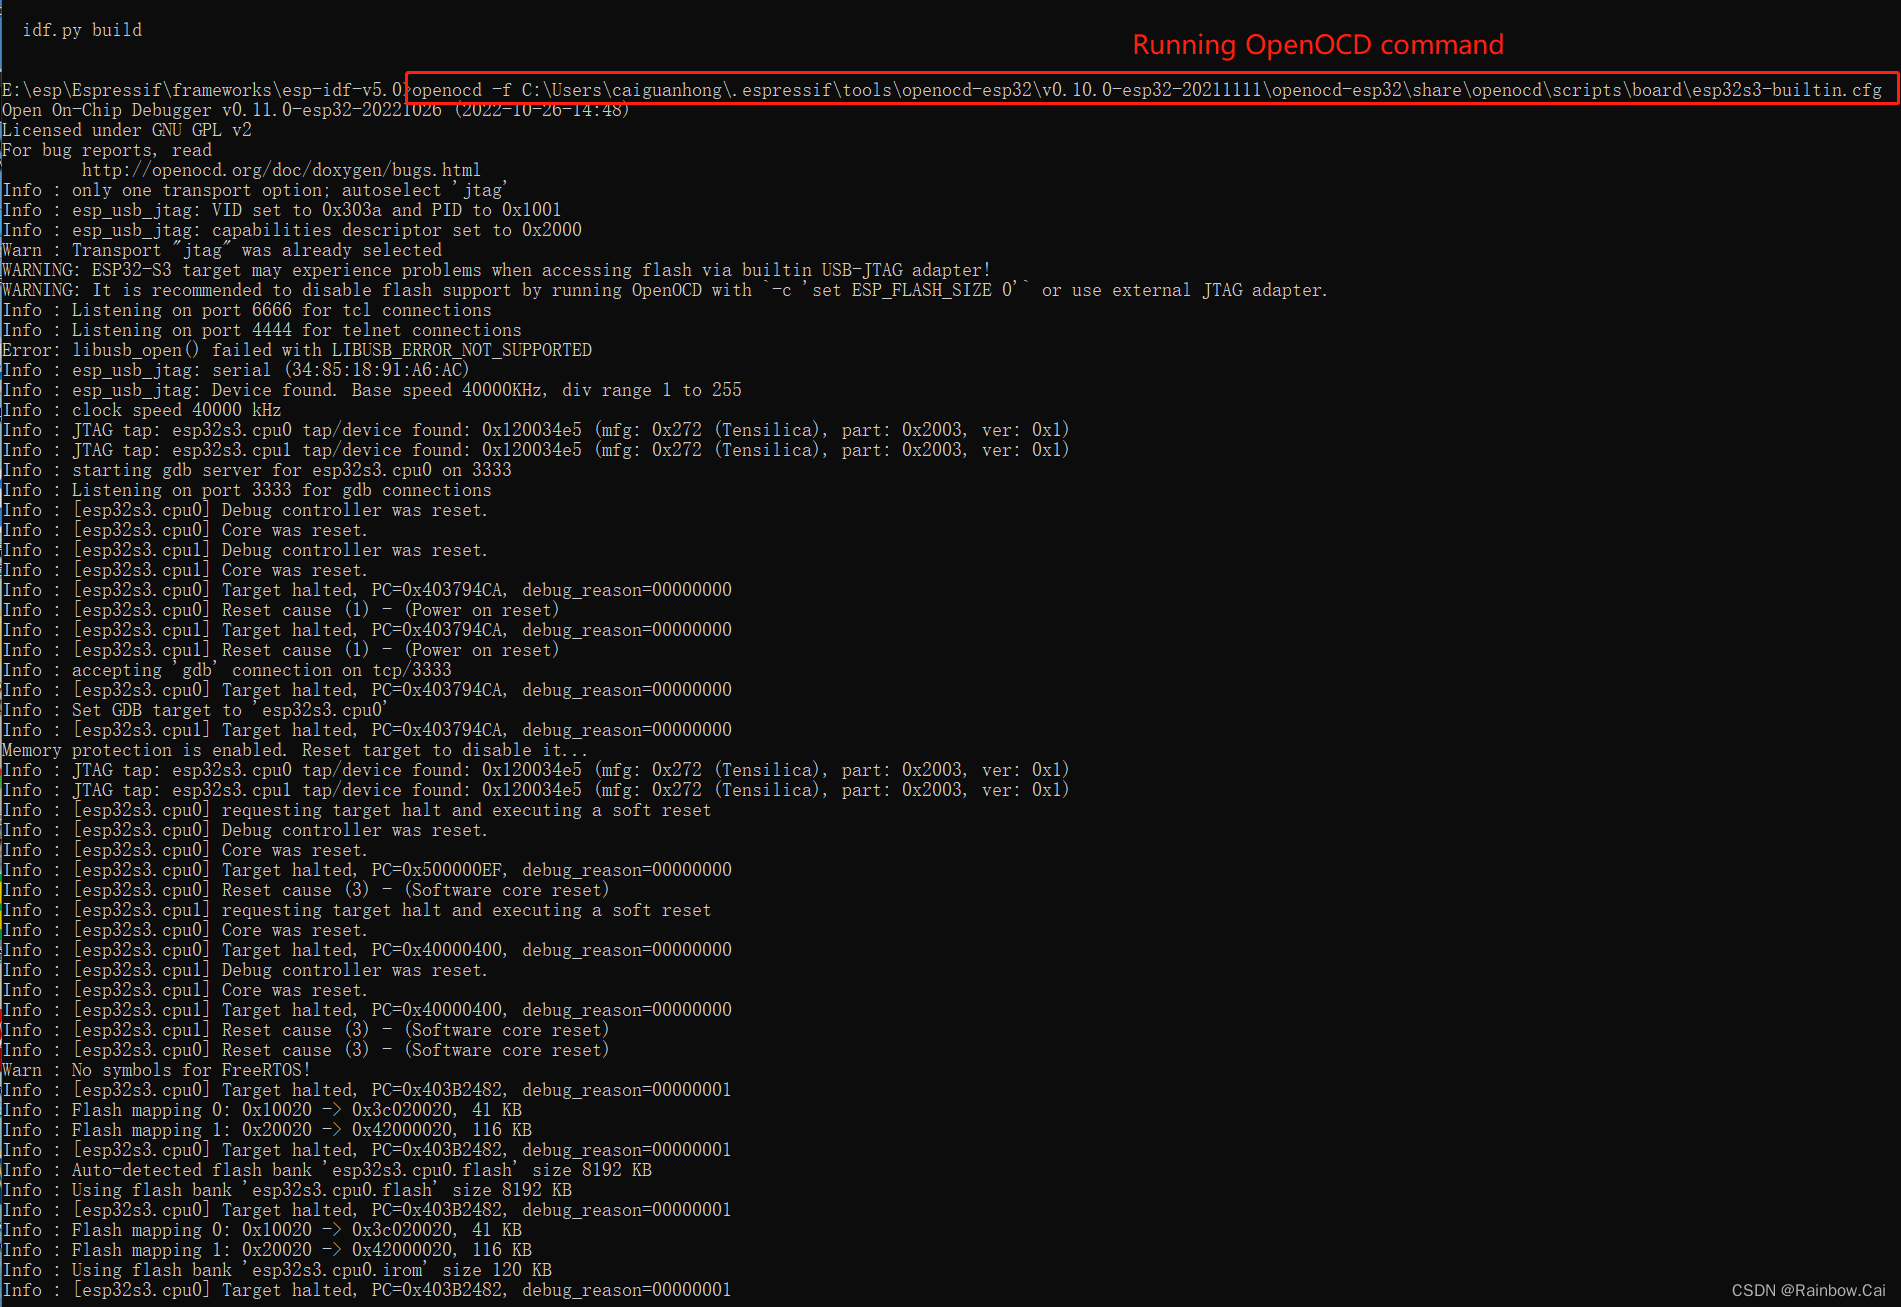
4.2 Running OpenOCD
-
We recommend to open a new esp-idf CMD terminal environment, then to running the “openocd” environment,Please refer to the "Run OpenOCD " . For example,
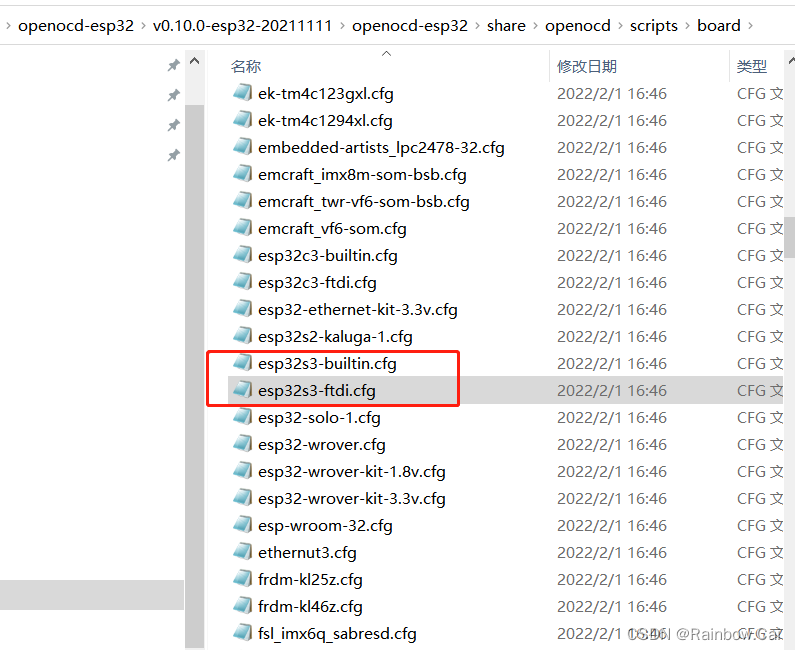
- If you are using the
USB Pins for Debugging, you need to use the “openocd” command to running the “esp32s3-builtin.cfg” file.
- If you are using the
openocd -f C:\Users\caiguanhong\.espressif\tools\openocd-esp32\v0.10.0-esp32-20211111\openocd-esp32\share\openocd\scripts\board\esp32s3-builtin.cfg
-
- If you are using the
JTAG Pins for Debugging, you need to use the “openocd” command to running the “esp32s3-ftdi.cfg” file.
- If you are using the
openocd -f C:\Users\caiguanhong\.espressif\tools\openocd-esp32\v0.10.0-esp32-20211111\openocd-esp32\share\openocd\scripts\board\esp32s3-ftdi.cfg
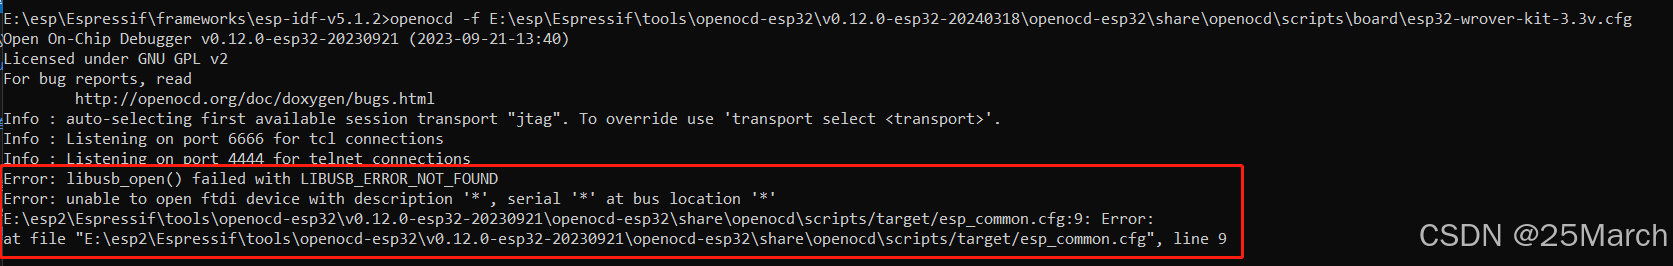
【Note】
If you get similar the follows error report when running openocd commands, please try to install the zadig tool to resolve the problem. Please refer to “Windows - manual driver change” instructions.
E:\esp\Espressif\frameworks\esp-idf-v5.1.2>openocd -f E:\esp\Espressif\tools\openocd-esp32\v0.12.0-esp32-20240318\openocd-esp32\share\openocd\scripts\board\esp32-wrover-kit-1.8v.cfg
Open On-Chip Debugger v0.12.0-esp32-20230921 (2023-09-21-13:40)
Licensed under GNU GPL v2
For bug reports, read
        http://openocd.org/doc/doxygen/bugs.html
Info : auto-selecting first available session transport "jtag". To override use 'transport select <transport>'.
Info : Listening on port 6666 for tcl connections
Info : Listening on port 4444 for telnet connections
Error: libusb_open() failed with LIBUSB_ERROR_NOT_FOUND
Error: unable to open ftdi device with description '*', serial '*' at bus location '*'
E:\esp2\Espressif\tools\openocd-esp32\v0.12.0-esp32-20230921\openocd-esp32\share\openocd\scripts/target/esp_common.cfg:9: Error:
at file "E:\esp2\Espressif\tools\openocd-esp32\v0.12.0-esp32-20230921\openocd-esp32\share\openocd\scripts/target/esp_common.cfg", line 9
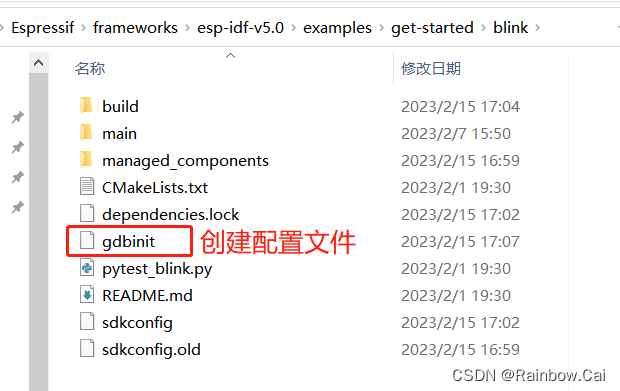
4.3 Create a configuration file and name it gdbinit
- Under the current debug project, create a configuration file named “
gdbinit” and write the following. Please read the “Command Line ” instructions.
target remote :3333
set remote hardware-watchpoint-limit 2
mon reset halt
flushregs
thb app_main
c
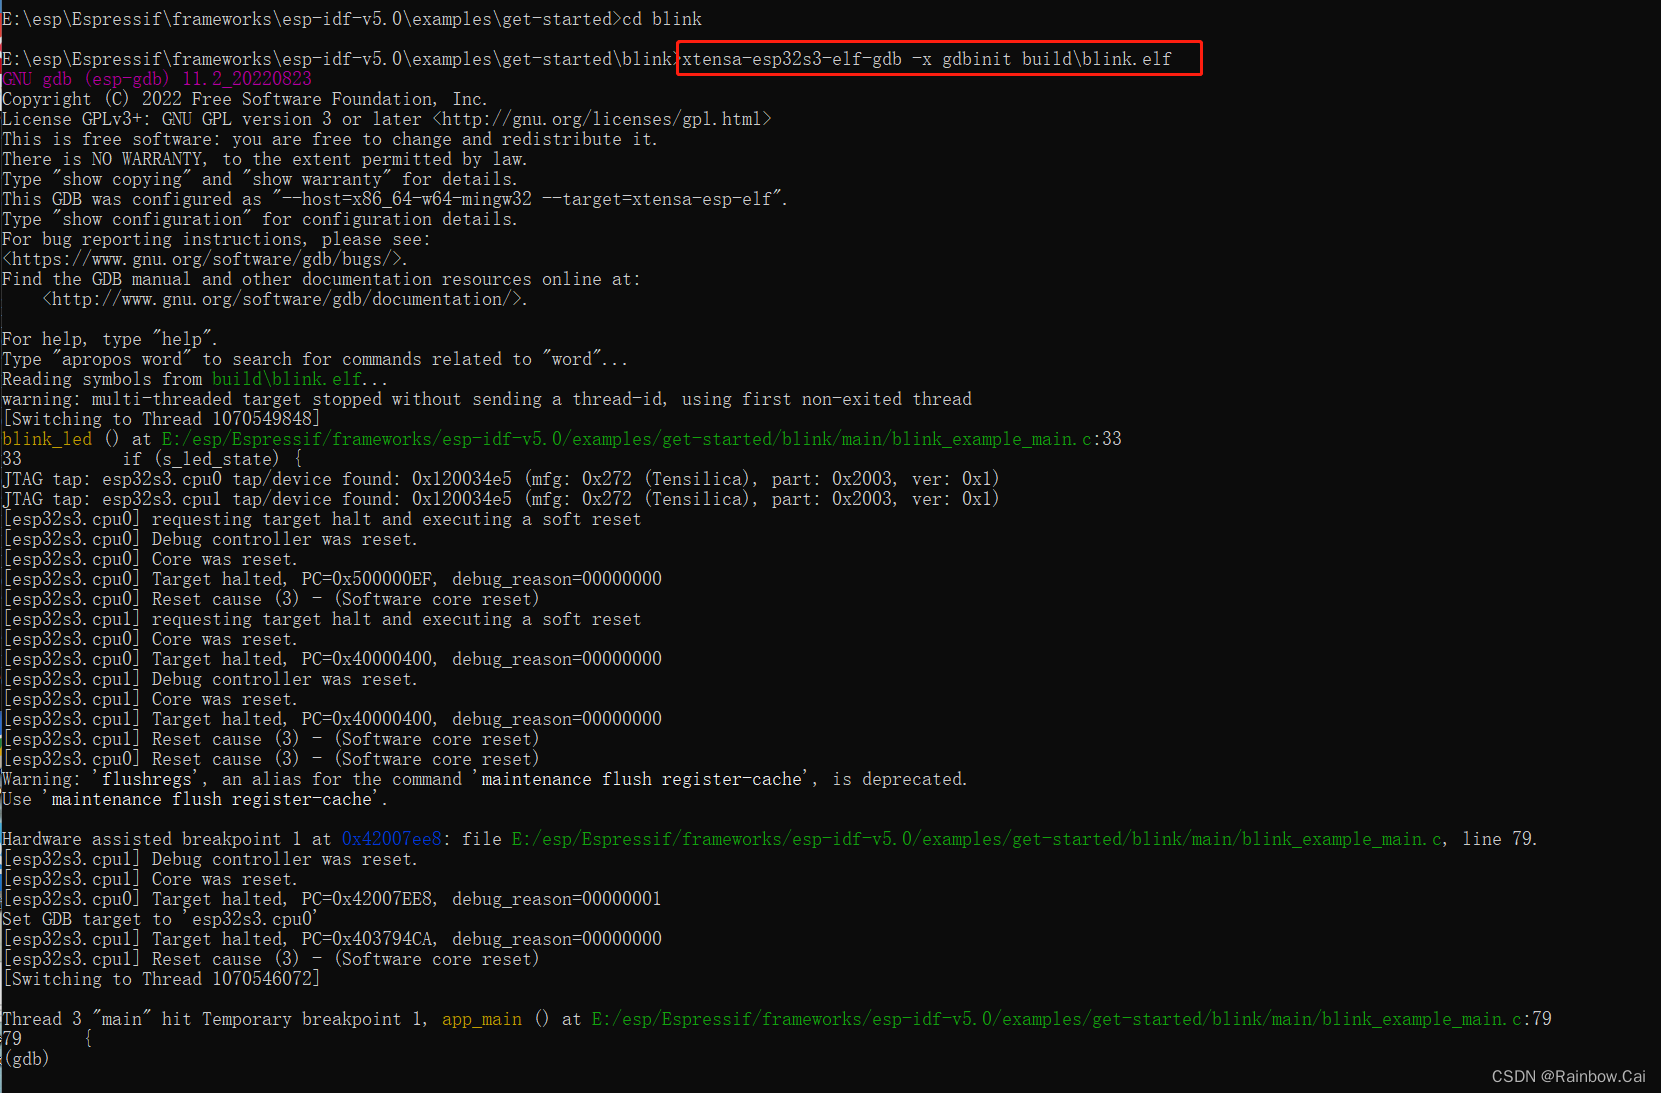
4.4 Ready to launch GDB
-
We recommend to
open a new esp-idf CMD terminal environment, and to enable the “GDB” environment. Please refer to “Command Line” . -
You need to running your project "
.elf" file, As follows:
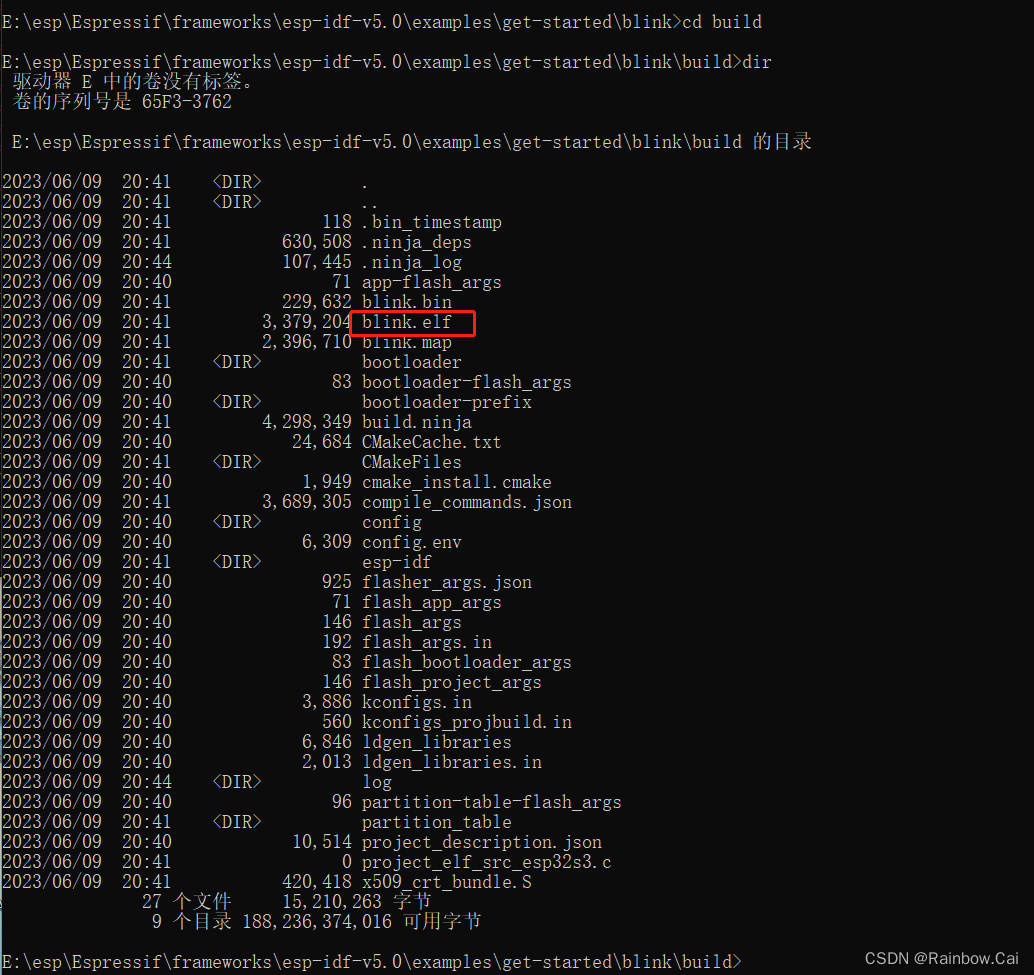
- Ready to launch GDB
xtensa-esp32s3-elf-gdb -x gdbinit build\blink.elf
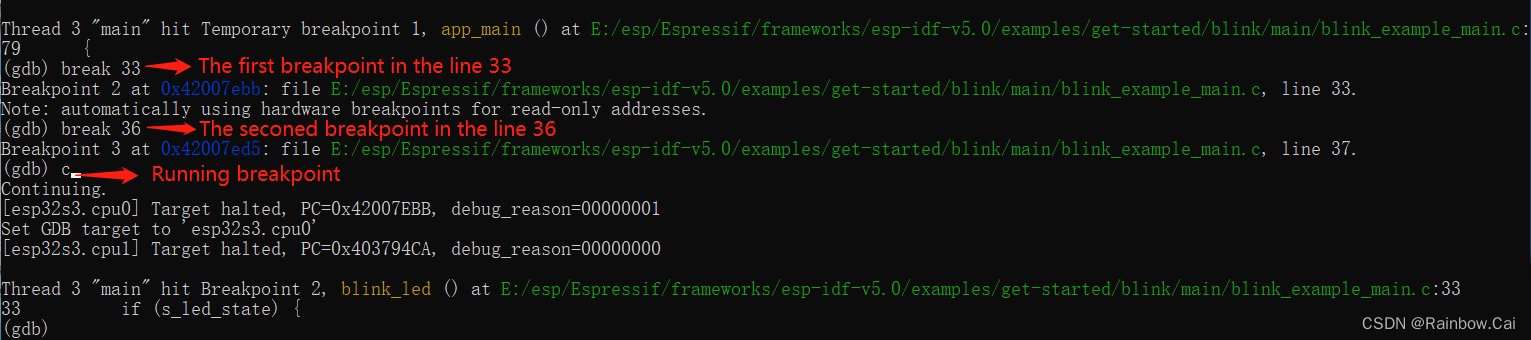
4.5 Setting and clearing breakpoints
- Use the gdb
break 33command to set the breakpoints - Use the gdb
ccommand to running breakpoints
As follows:
For more guide ,please refer to “Debugging Examples”
The BSDL file can refer to “openocd-esp32 ” Source Code.

一站式 AI 云服务平台
更多推荐

 0
0 0
0- 0


 已为社区贡献3条内容

所有评论(0)