
从后端数据库获取数据并传值到前端vue项目的echarts柱状图/折线图/饼图里
不同图表的数据获取有一定的区别在这些区别上花了不少功夫试验,把最后成功的方法做个记录,如果有类似项目要做的话,也可看看当个参考。后端后端都大同小异,方法上没有区别,在这里以柱状图为例。sql:数据库的表格先写好,名称、类型、数据,然后连接数据库用的是Navicat写,表名:sys_mapbar在IDEA里,写XML文件,与数据库调用直接相关的语句<?xml version="1.0" enc
·
不同图表的数据获取有一定的区别
在这些区别上花了不少功夫试验,把最后成功的方法做个记录,如果有类似项目要做的话,也可看看当个参考。
后端
后端都大同小异,方法上没有区别,在这里以柱状图为例。
sql:数据库的表格先写好,名称、类型、数据,然后连接数据库
用的是Navicat写,表名:sys_mapbar
在IDEA里,写XML文件,与数据库调用直接相关的语句
<?xml version="1.0" encoding="UTF-8" ?>
<!DOCTYPE mapper
        PUBLIC "-//mybatis.org//DTD Mapper 3.0//EN"
        "http://mybatis.org/dtd/mybatis-3-mapper.dtd">
<mapper namespace="com.jdy.project.system.mapper.SysMapBarMapper">

    <resultMap type="SysMapBar" id="SysMapBarResult">
        <result property="barInCount"   column="bar_incount"/>
        <result property="barOutCount"  column="bar_outcount"/>
        <result property="barDate"      column="bar_date"/>
    </resultMap>

    <sql id="selectSysMapBarVo">
        select bar_incount,bar_outcount,bar_date from sys_mapbar
    </sql>

    <select id="selectSysMapBarList" parameterType="SysMapBar" resultMap="SysMapBarResult">
        <include refid="selectSysMapBarVo"/>
        <where>
            <if test="barInCount != null and barInCount != ''">and bar_incount = #{barInCount}</if>
            <if test="barOutCount != null and barOutCount != ''">and bar_outcount = #{barOutCount}</if>
            <if test="barDate != null and barDate != ''">and bar_date = #{barDate}</if>
        </where>
    </select>

</mapper>
然后vo实体类和Mapper方法,
//vo实体类,set/get/toString方法
public class SysMapBar extends BaseEntity {

    @Excel(name = "入库数量")
    private String barInCount;
    @Excel(name = "出库数量")
    private String barOutCount;
    @Excel(name = "日期")
    private String barDate;

    public String getBarInCount() {
        return barInCount;
    }

    public void setBarInCount(String barInCount) {
        this.barInCount = barInCount;
    }

    public String getBarOutCount() {
        return barOutCount;
    }

    public void setBarOutCount(String barOutCount) {
        this.barOutCount = barOutCount;
    }

    public String getBarDate() {
        return barDate;
    }

    public void setBarDate(String barDate) {
        this.barDate = barDate;
    }

    @Override
    public String toString() {
        return new ToStringBuilder(this, ToStringStyle.MULTI_LINE_STYLE)
                .append("barInCount", getBarInCount())
                .append("barOutCount", getBarOutCount())
                .append("barDate", getBarDate())
                .toString();
    }
}
//Mapper方法
public interface SysMapBarMapper {

    public List<SysMapBar> selectSysMapBarList(SysMapBar sysMapBar);
}
Mapper层相当于dao层,对数据库进行数据持久化操作,方法语句直接针对数据库操作,而Service层针对Controller,Service的impl是把Mapper和Service进行整合的文件。
然后写Service和ServiceImpl,这些文件写的顺序不一定,自己的逻辑不会混乱就行
//Service
public interface ISysMapBarService {

    public List<SysMapBar> selectSysMapBarList(SysMapBar sysMapBar);

}
//ServiceImpl
@Service
public class SysMapBarServiceImpl implements ISysMapBarService {
    @Autowired            //@Autowired 注释,它可以对类成员变量、方法及构造函数进行标注,完成自动装配的工作。
    private SysMapBarMapper sysMapBarMapper;

    @Override             //一般用途:帮助自己检查是否正确的复写了父类中已有的方法告诉读代码的人,这是一个复写的方法
    public List<SysMapBar> selectSysMapBarList(SysMapBar sysMapBar) {
        return sysMapBarMapper.selectSysMapBarList(sysMapBar);
    }
}
最后是Controller,配置接口路径
//Controller
@RestController
@RequestMapping("/dashboard/barchart")
public class SysMapBarController extends BaseController {

    @Autowired
    private ISysMapBarService sysMapBarService;

    @ResponseBody
    @PreAuthorize("@ss.hasPermi('dashboard:barchart:listBar')")     //权限访问设置
    @GetMapping("/listBar" )
    public TableDataInfo listBar(SysMapBar sysMapBar){
        List<SysMapBar> listBar = sysMapBarService.selectSysMapBarList(sysMapBar);
        return getDataTable(listBar);
    }
}
前端
若依框架的路由,同步在src/api的同名文件里写js文件

在调用echarts的vue中随之更改项目路径
barchart.js
import request from '@/utils/request'

//查询bar列表
export function listBar(query){
  return request({
    url: '/dashboard/barchart/listBar',
    method:'get',
    params: query
  })
}
1.柱状图
<!--柱状图-->
<template>
  <div :class="className" :style="{height:height,width:width}" />
</template>

<script>
  import echarts from 'echarts'
  require('echarts/theme/macarons')   // echarts theme
  import resize from './../mixins/resize'
  import { listBar } from "@/api/dashboard/barchart";

  const animationDuration = 3000

  export default {
    mixins: [resize],
    props: {
      className: {
        type: String,
        default: 'chart'
      },
      width: {
        type: String,
        default: '760px'
      },
      height: {
        type: String,
        default: '303px'
      }
    },
    data() {
      return {
        MapList:[],
        rows:[],
        BarList:[],
        barInCount:[],
        barOutCount:[],
        barDate :[],
        chart: null,
        queryParams: {
          barInCount: undefined,
          barOutCount: undefined,
          barDate: undefined,
        },
      }
    },
    mounted() {
      this.$nextTick(() => {
        this.initChart()
      })
    },
    beforeDestroy() {
      if (!this.chart) {
        return
      }
      this.chart.dispose()
      this.chart = null
    },
    created() {
      this.getBarList();
    },
    methods: {
      getBarList() {
        this.loading = true;
        listBar(this.queryParams).then(response => {
          this.MapList =response.rows;
          console.log( "柱状图数据:" + this.MapList);         // 确认数据有获取到
          let MapList = this.MapList;
          if(MapList){
            let obj = eval(MapList);
            for(let i=0;i<obj.length;i++){
              this.barInCount.push(MapList[i].barInCount);
              this.barOutCount.push(MapList[i].barOutCount);
              this.barDate.push(MapList[i].barDate);
            }
          }
          //动态插入数据时,数据在这里设置更新
          this.chart.setOption({
            xAxis: {
              data: this.barDate
            },
            series: [{
              name: '入库数量',
              data: this.barInCount,
            },
            {
              name: '出库数量',
              data: this.barOutCount,
            }]
          });
        });
      },
      initChart() {
        this.chart = echarts.init(this.$el, 'macarons')
        this.chart.setOption({
          tooltip: {
            trigger: 'axis',
            axisPointer: { // 坐标轴指示器,坐标轴触发有效
              type: 'shadow' // 默认为直线,可选为:'line' | 'shadow'
            }
          },
          grid: {
            top: 30,
            left: '2%',
            right: '2%',
            bottom: '3%',
            containLabel: true
          },
          xAxis: [{
            type: 'category',
            data: this.barDate,
            axisTick: {
              alignWithLabel: true
            }
          }],
          yAxis: [{
            type: 'value',
            axisTick: {
              show: false
            }
          }],
          legend: {
            data: ['入库数量', '出库数量'],
            textStyle:{
              // fontSize: 16,
              color: 'white'
            }
          },
          series: [{
            name: '入库数量',
            type: 'bar',
            stack: 'Amount',
            barWidth: '10%',
            data: this.barInCount,
            itemStyle: {
              normal: {
                label: {
                  show: true, //开启显示
                  position: 'top', //在上方显示
                  textStyle: { //数值样式
                    color: 'white',
                    // fontSize: 16
                  }
                }
              }
            },
            animationDuration
          }, {
            name: '出库数量',
            type: 'bar',
            stack: 'count',
            barWidth: '10%',
            data: this.barOutCount,
            itemStyle: {
              normal: {
                label: {
                  show: true, //开启显示
                  position: 'top', //在上方显示
                  textStyle: { //数值样式
                    color: 'white',
                    // fontSize: 16
                  }
                }
              }
            },
            animationDuration
          }]
        })
      },

    }
  }
</script>
data返回值,created创建方法名,methods写方法
注意:this.chart.setOption()方法要写在listBar方法的内部,动态获取数据库数据来更新echaers图表。
效果图: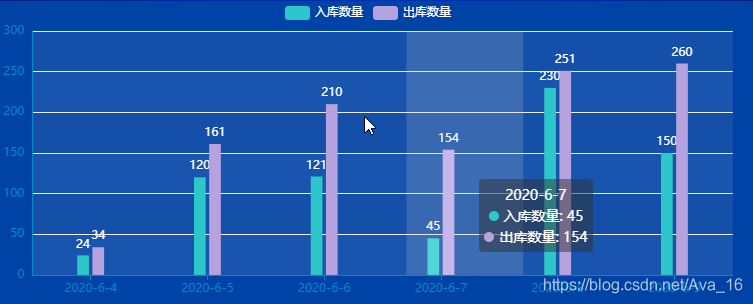
2.折线图
<!--折线图-->
<template>
  <div :class="className" :style="{height:height,width:width}"></div>
</template>

<script>
  import echarts from 'echarts'
  require('echarts/theme/macarons') // echarts theme
  import resize from './../mixins/resize'
  import { listLine } from "@/api/dashboard/linechart"

  export default {
    mixins: [resize],
    props: {
      className: {
        type: String,
        default: 'chart'
      },
      width: {
        type: String,
        default: '760px'
      },
      height: {
        type: String,
        default: '303px'
      },
      autoResize: {
        type: Boolean,
        default: true
      },
    },
    data() {
      return {
        chart: null,
        MapList:[],
        rows:[],
        LineList:[],
        lineInAmount:[],
        lineOutAmount:[],
        lineDate :[],
        queryParams: {
          lineInAmount: undefined,
          lineOutAmount: undefined,
          lineDate: undefined,
        },
      }
    },
    mounted() {
      this.$nextTick(() => {
        this.initChart()
      })
    },
    beforeDestroy() {
      if (!this.chart) {
        return
      }
      this.chart.dispose()
      this.chart = null
    },
    created() {
      this.getLineList();
    },
    methods: {
      getLineList(){
        this.loading = true;
        listLine(this.queryParams).then(response => {
          this.MapList = response.rows;
          console.log( "折线图数据:" + this.MapList);
          let MapList = this.MapList;
          if(MapList) {
            let obj = eval(MapList);      //eval() 函数可计算某个字符串,并执行其中的的 JavaScript 代码。返回值是通过计算 string 而得到的值
            for (let i = 0; i < obj.length; i++) {
              this.lineInAmount.push(MapList[i].lineInAmount);
              this.lineOutAmount.push(MapList[i].lineOutAmount);
              this.lineDate.push(MapList[i].lineDate);
            }
          }
          this.chart.setOption({
            xAxis: {
              data: this.lineDate
            },
            series: [{
              name: '入库金额',
              data: this.lineInAmount,
            },
              {
                name: '出库金额',
                data: this.lineOutAmount,
              }]
          });
        });
      },
      initChart() {
        this.chart = echarts.init(this.$el, 'macarons')
        this.chart.setOption({
          xAxis: {
            data: this.lineDate,
            boundaryGap: false,
            axisTick: {
              show: false
            }
          },
          grid: {
            left: 10,
            right: 10,
            bottom: 20,
            top: 30,
            containLabel: true
          },
          tooltip: {
            trigger: 'axis',
            axisPointer: {
              type: 'cross'
            },
            padding: [5, 10]
          },
          yAxis: {
            axisTick: {
              show: false
            }
          },
          legend: {
            data: ['入库金额', '出库金额'],
            textStyle:{
              color: 'white'
            }
          },
          series: [{
            name: '入库金额', itemStyle: {
              normal: {
                color: '#FF005A',
                lineStyle: {
                  color: '#FF005A',
                  width: 2
                }
              }
            },
            smooth: true,
            type: 'line',
            data:  this.lineInAmount,
            animationDuration: 2800,
            animationEasing: 'cubicInOut'
          },
            {
              name: '出库金额',
              smooth: true,
              type: 'line',
              itemStyle: {
                normal: {
                  color: '#3888fa',
                  lineStyle: {
                    color: '#45E4A5',
                    width: 2
                  },
                }
              },
              data: this.lineOutAmount,
              animationDuration: 2800,
              animationEasing: 'quadraticOut'
            }]
        })
      },
    }
  }
</script>
效果图: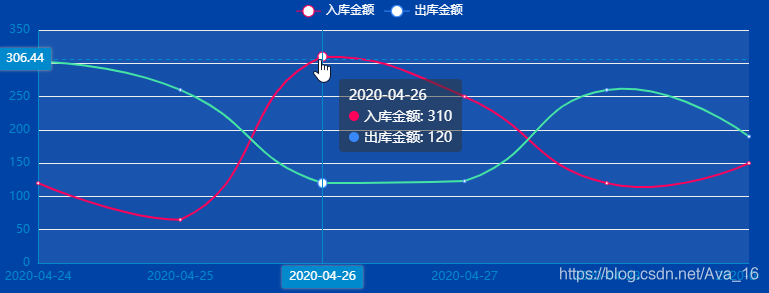
3.饼图
饼图有些麻烦,数据获取那里用了很多形式,能获取到数组但是legend显示不出来。
<template>
  <div :class="className" :style="{height:height,width:width}" />
</template>

<script>
  import echarts from 'echarts'
  require('echarts/theme/macarons')
  import resize from './../mixins/resize'
  import { listCtrlPie } from "@/api/dashboard/ctrlpie";


  export default {
    mixins: [resize],
    props: {
      className: {
        type: String,
        default: 'chart'
      },
      width: {
        type: String,
        default: '100%'
      },
      height: {
        type: String,
        default: '230px'
      }
    },
    data() {
      return {
        chart: null,
        MapList: [],
        rows: [],
        queryParams: {
          PieValue: undefined,
          PieName: undefined,
        },
      }
    },
    mounted() {
      this.$nextTick(() => {
        this.initChart()
        this.getList()
      })
    },
    beforeDestroy() {
      if (!this.chart) {
        return
      }
      this.chart.dispose()
      this.chart = null
    },
    methods: {
      async getList() {
        var valueData = [];
        var nameData = [];
        var totalData = [];
        this.loading = true;
        await listCtrlPie(this.queryParams).then(response => {
          this.MapList = response.rows;
          console.log("地图饼状图数据:" + this.MapList);         //数据有获取到,javaScript格式的
          let MapList = this.MapList;
          if (MapList) {
            let obj = eval(MapList);
            for (let i = 0; i < obj.length; i++) {
              nameData.push(obj[i].pieName);
              valueData.push(obj[i].pieValue);
              totalData.push([obj[i].pieValue,obj[i].pieName])
            }
          }
          this.chart.setOption({
            legend: {
              data: nameData,
            },
            series: [{
              data: totalData
            }]
          });
        });
      },
      initChart() {
        this.chart = echarts.init(this.$el, 'macarons')
        console.log("加载");
        this.chart.setOption({
          title: {
            text: '资产总额:',
            top: 20,
            left:20,
            textStyle: {
              color: 'white',
              fontSize:16,
            }
          },
          tooltip: {
            trigger: 'item',
            formatter: '{a} <br/>{b} : {c} ({d}%)'
          },
          legend: {
            orient: 'vertical',
            right: 10,
            data: [],
            textStyle: {
              fontSize: 16,
              color: 'white',
            },
            position: 'relative',
            top: '90px',
            margin: '15px'
          },

          series: [
            {
              name: '资产总额',
              type: 'pie',
              radius: ['35%', '70%'],
              avoidLabelOverlap: false,
              center: ["30%", "65%"], //饼图的位置【前后,上下】
              emphasis: {
                label: {
                  show: true,
                  fontSize: '30',
                }
              },
              itemStyle: {
                normal: {
                  label: {
                    show: false,
                    formatter: '{b} : {c} ({d}%)'
                  },
                  labelLine: {show: false}
                }
              },
              data: [],
            }
          ]
        })
      },
    },
  }
</script>
效果图: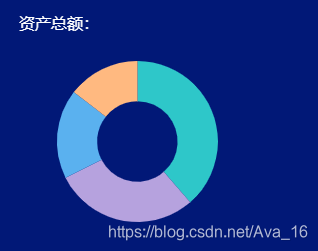
其实如果不需要追求把数据列表形式在旁边列出来,只是显示这样还是可以实现的。
以上,个人记录,仅作参考。

一站式 AI 云服务平台
更多推荐


 41
41 0
0- 0


 已为社区贡献1条内容

所有评论(0)