
【Prometheus】使用Loki+Promtail+Grafana进行日志监控
1、目录规划目录说明:bin:存放loki、promtail的可执行文件;config:存放loki、promtail的启动配置文件;logs:存放loki、promtail的日志文件;# tree lokiloki├── bin│├── loki│└── promtail├── config│├── loki-local-config.yaml│└── promtail-local-config
目录说明:
bin:存放loki、promtail的可执行文件;
config:存放loki、promtail的启动配置文件;
logs:存放loki、promtail的日志文件;
|
# tree loki loki ├── bin │ ├── loki │ └── promtail ├── config │ ├── loki-local-config.yaml │ └── promtail-local-config.yaml ├── logs │ ├── loki-nohup.log │ └── promtail-nohup.log ├── loki-start.sh └── promtail-start.sh 3 directories, 8 files |
由于使用的操作系统为CentOS 7.9,因此从官网下载Loki的Linux安装包,官方当前最新的release版本(2.5.0)的下载页面:
https://github.com/grafana/loki/releases/
安装包下载地址:
https://github.com/grafana/loki/releases/download/v2.5.0/loki-linux-amd64.zip
https://github.com/grafana/loki/releases/download/v2.5.0/promtail-linux-amd64.zip
如果服务器能连接外网,我们可以直接通过wget命令将包下载到服务器上。
|
# pwd /data/loki # wget https://github.com/grafana/loki/releases/download/v2.5.0/loki-linux-amd64.zip # wget https://github.com/grafana/loki/releases/download/v2.5.0/promtail-linux-amd64.zip |
直接通过unzip命令将两个zip包解压,然后将可执行程序重命名后,移动到bin目录下即可。解压后需要注意,两个可执行文件的权限是不是755,如果不是需要赋予执行权限。
|
-rwxr-xr-x 1 root root 54554624 4月 8 05:53 loki -rwxr-xr-x 1 root root 80224856 4月 8 06:04 promtail |
同样,用wget将两个配置文件下载到config目录下。
|
# wget https://raw.githubusercontent.com/grafana/loki/master/cmd/loki/loki-local-config.yaml # wget https://raw.githubusercontent.com/grafana/loki/main/clients/cmd/promtail/promtail-local-config.yaml # ls -ltr 总用量 8 -rw-r--r-- 1 root root 1193 6月 14 14:55 loki-local-config.yaml -rw-r--r-- 1 root root 345 6月 14 16:02 promtail-local-config.yaml |
下载后需要修改配置文件的默认配置,配置如下:
loki-local-config.yaml
|
auth_enabled: false server: http_listen_port: 3100 grpc_listen_port: 9096 common: path_prefix: /tmp/loki storage: filesystem: chunks_directory: /tmp/loki/chunks rules_directory: /tmp/loki/rules replication_factor: 1 ring: instance_addr: 192.168.223.199 kvstore: store: inmemory schema_config: configs: - from: 2020-10-24 store: boltdb-shipper object_store: filesystem schema: v11 index: prefix: index_ period: 24h ruler: alertmanager_url: http://localhost:9093 # By default, Loki will send anonymous, but uniquely-identifiable usage and configuration # analytics to Grafana Labs. These statistics are sent to https://stats.grafana.org/ # # Statistics help us better understand how Loki is used, and they show us performance # levels for most users. This helps us prioritize features and documentation. # For more information on what's sent, look at # https://github.com/grafana/loki/blob/main/pkg/usagestats/stats.go # Refer to the buildReport method to see what goes into a report. # # If you would like to disable reporting, uncomment the following lines: #analytics: # reporting_enabled: false |
promtail-local-config.yaml
|
server: http_listen_port: 9080 grpc_listen_port: 0 positions: filename: /tmp/positions.yaml clients: - url: http://192.168.223.199:3100/loki/api/v1/push scrape_configs: - job_name: system static_configs: - targets: - tomcat-logs labels: job: tomcat-log __path__: /data/apache-tomcat-8.5.81/logs/*.log |
|
# cat loki-start.sh nohup /data/loki/bin/loki -config.file=/data/loki/config/loki-local-config.yaml 2>&1 >/data/loki/logs/loki-nohup.log & |
|
# cat promtail-start.sh nohup /data/loki/bin/promtail -config.file=/data/loki/config/promtail-local-config.yaml 2>&1 >/data/loki/logs/promtail-nohup.log & |
Loki启动成功以后,可以在浏览器通过下面的地址来访问metrics数据:
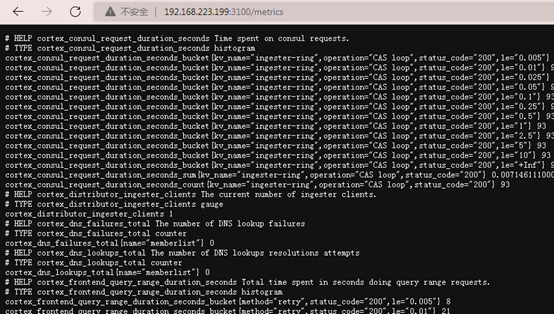
备注:启动的时候直接复制nohup这段执行进程启动,直接执行脚本貌似有点问题。
Grafana的安装过程这里就省略了,网上很多介绍的文章,可自行搜索查阅。
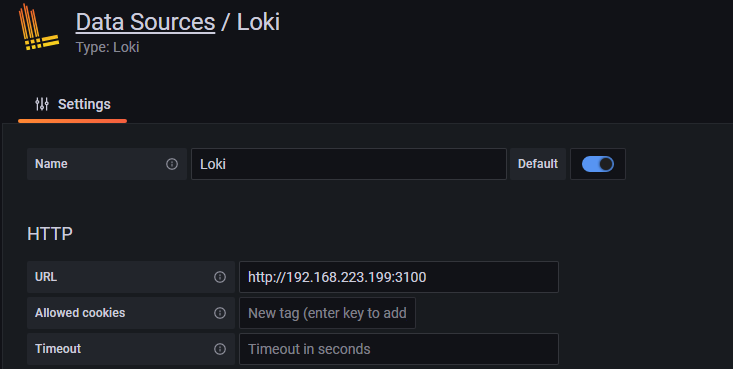
安装完成后,登录到grafana,在选择数据源的时候,将Loki选择为数据源,然后将Loki的地址配置进去即可。
Tomcat的安装过程这里就省略了,网上很多介绍的文章,可自行搜索查阅。
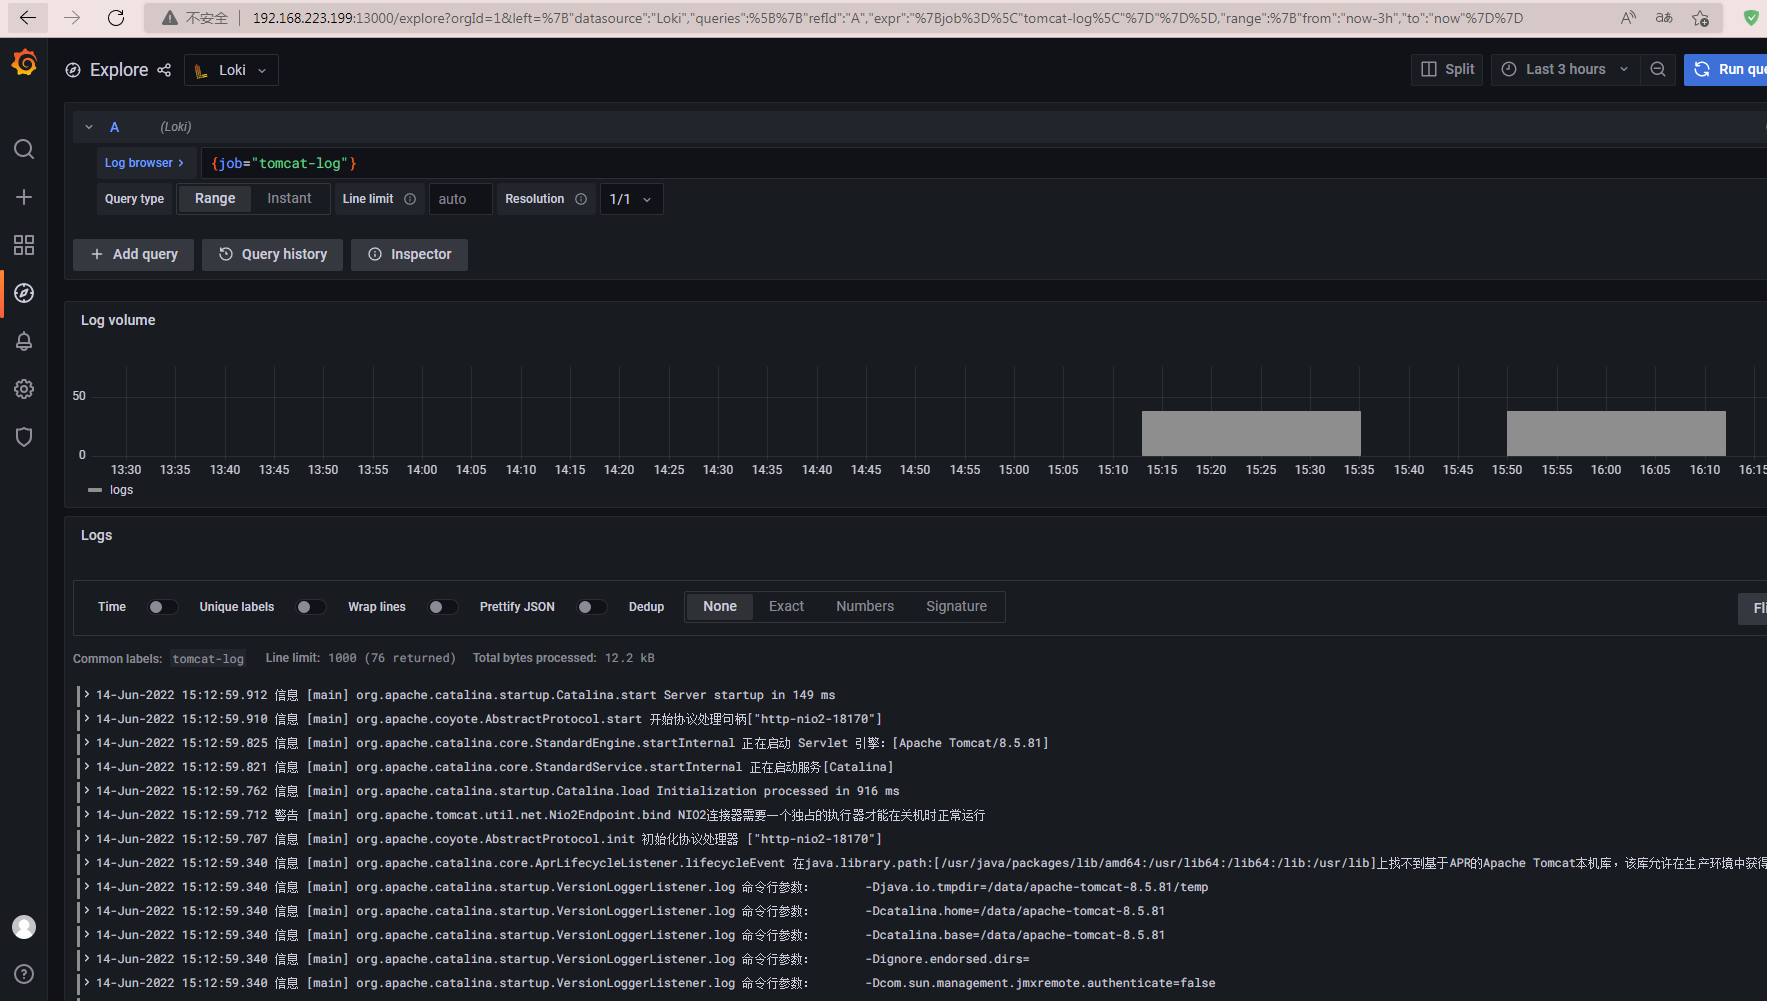
在日志浏览栏中数据筛选表达式:{job="tomcat-log"},点击左上角的Run query,即可查询并返回目标job的日志数据。
遗留问题:目前Promtail里面配置的日志路径,还是与这套系统在同一台服务器上安装配置的Tomcat,如何实现跨服务器的日志监控,目前还在研究中,不知道是不是需要通过第三方的日志聚合软件。

一站式 AI 云服务平台
更多推荐

 0
0 0
0- 0


 已为社区贡献1条内容

所有评论(0)