
JVM3_数据库连接池虚引用ConnectionFinalizerPhantomReference引起的FullGC压力问题排查
按照收集策略划分新生代收集器:Serial、ParNew、Parallel Scavenge;老年代收集器:Serial Old、Parallel Old、CMS;整堆分区收集器:G1、ZGC、Shenandoah吞吐量优先、停顿时间优先吞吐量优先:Parallel Scavenge收集器、Parallel Old 收集器。停顿时间优先:CMS(Concurrent Mark-Sweep)收集器。
背景
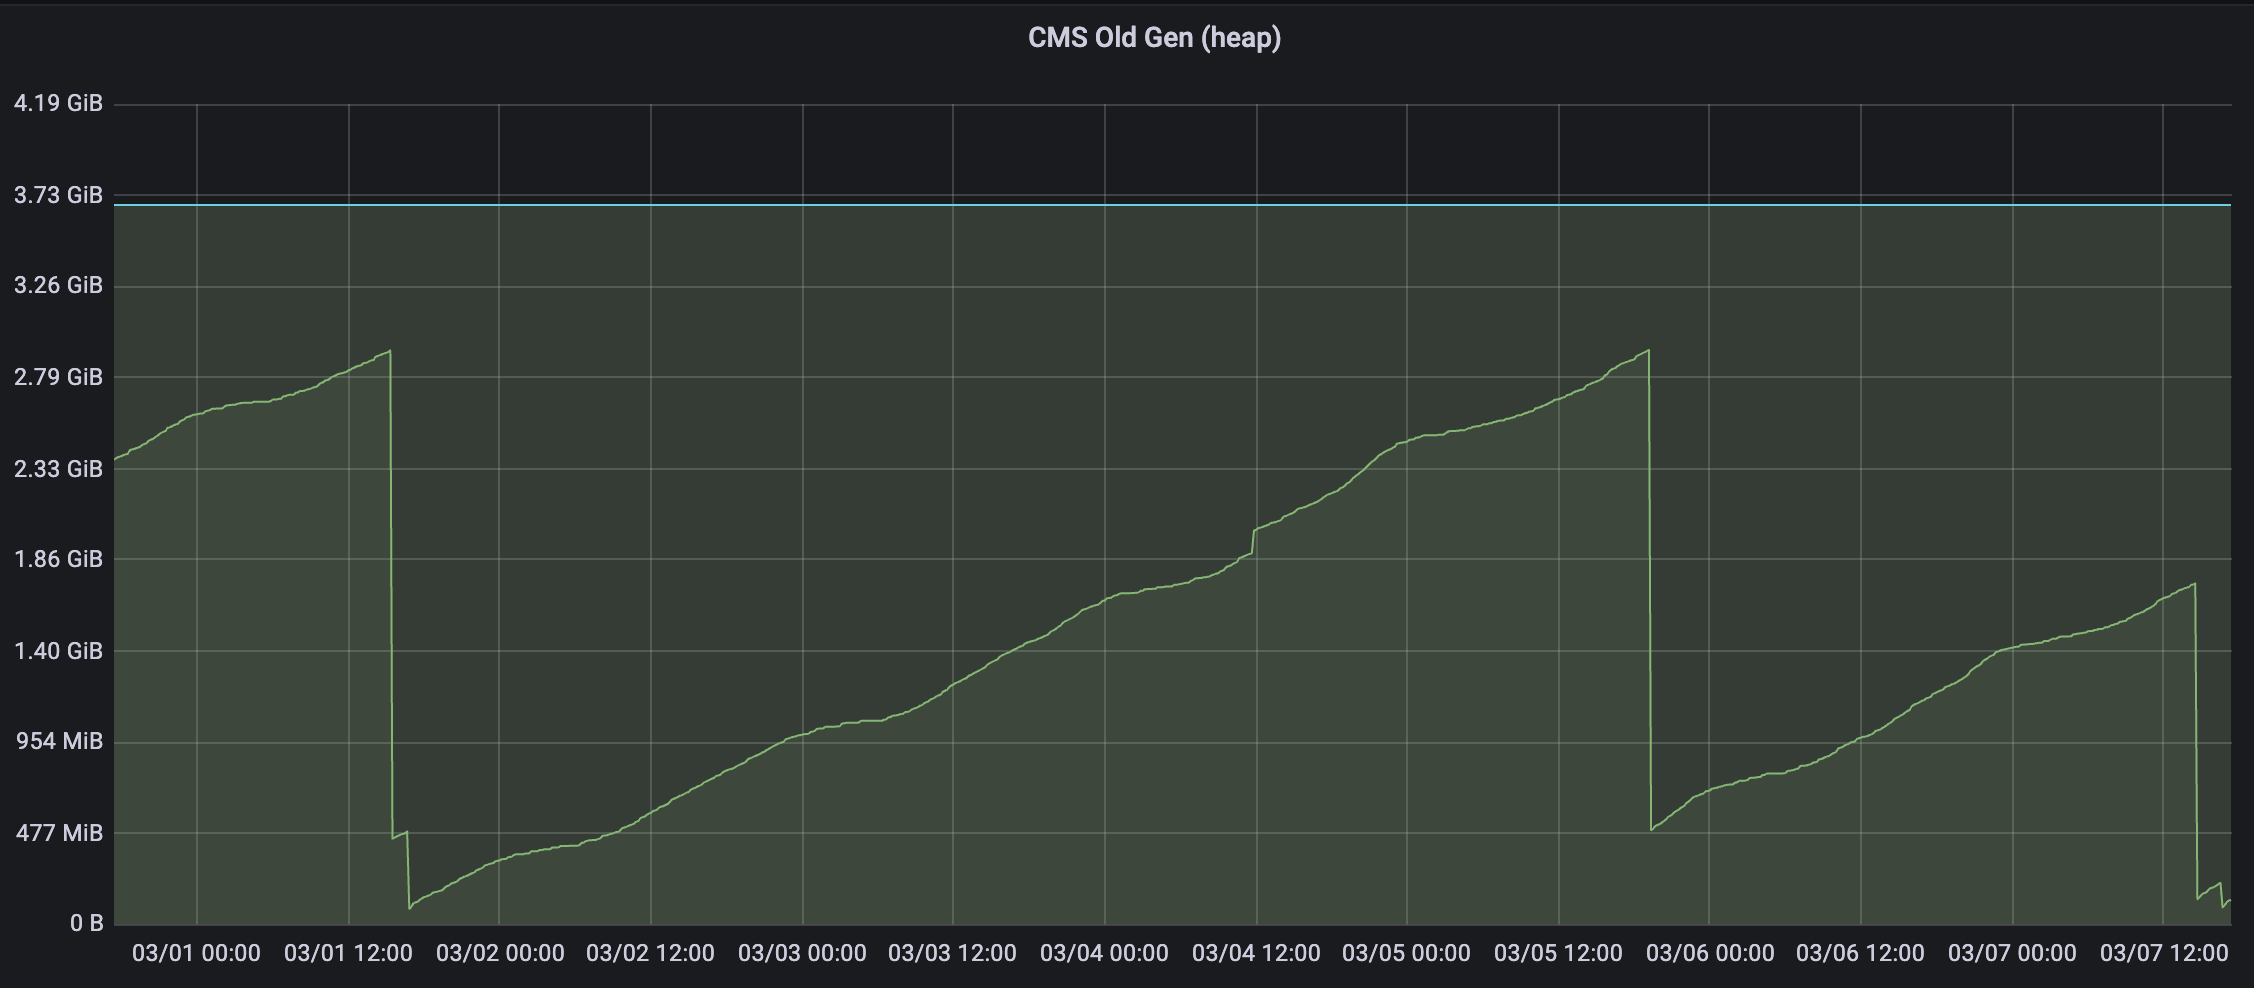
XOP服务运行期间,查看GC日志,发现时间相比之前时间略长,需要进行一次调查分析,分析原因尝试优化。
目录
- 垃圾收集器概述
- 常见的垃圾收集器
- 分区收集策略
- 为什么CMS没成为默认收集器
- 查看JVM运行时环境
- 分析快照
- PhantomReference虚引用
- AbandonedConnectionCleanupThread源码分析
- 原因分析
- 问题本地复现
- 解决方案
1、垃圾收集器概述
1.1、常见的垃圾收集器
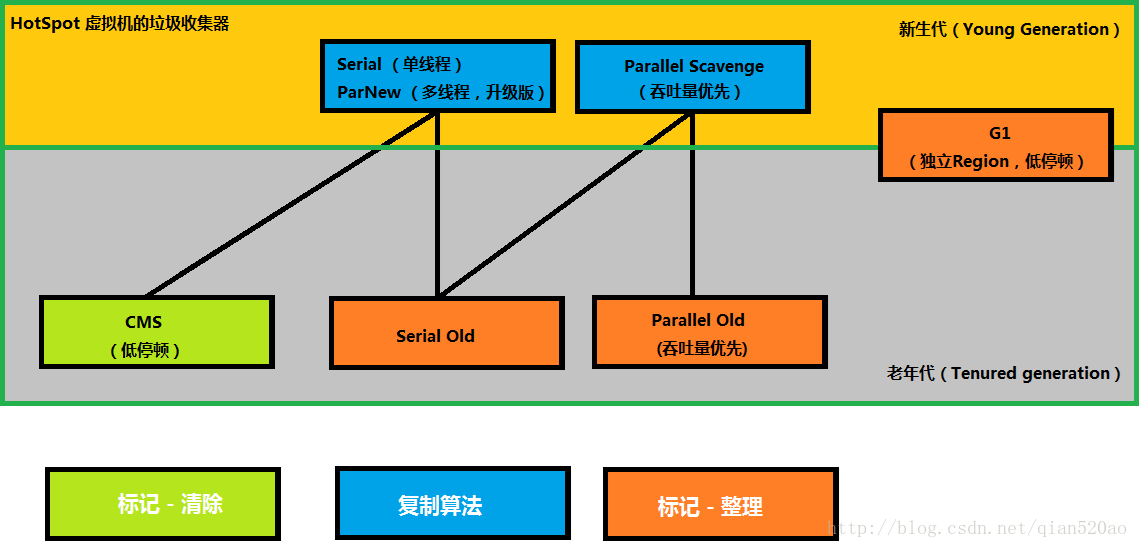
按照收集策略划分
- 新生代收集器:Serial、ParNew、Parallel Scavenge;
- 老年代收集器:Serial Old、Parallel Old、CMS;
- 整堆分区收集器:G1、ZGC、Shenandoah
吞吐量优先、停顿时间优先
- 吞吐量优先:Parallel Scavenge收集器、Parallel Old 收集器。
- 停顿时间优先:CMS(Concurrent Mark-Sweep)收集器。
吞吐量与停顿时间适用场景
- 吞吐量优先:交互少,计算多,适合在后台运算的场景。
- 停顿时间优先:交互多,对响应速度要求高
串行、并行、并发
- 串行:Serial、Serial Old,垃圾回收必须暂停全部工作线程,无法利用多核优势。
- 并行:ParNew、Parallel Scavenge、Parallel Old,并行描述的是多条垃圾收集器线程之前的关系,说明同一时间有多条垃圾收集器线程在工作,此时用户线程默认是处于等待状态。
- 并发:CMS、G1,并发描述的是垃圾收集器线程和用户线程之间的关系
算法,参考往期博客
- 复制算法:Serial、ParNew、Parallel Scavenge、G1
- 标记-清除:CMS
- 标记-整理:Serial Old、Parallel Old、G1
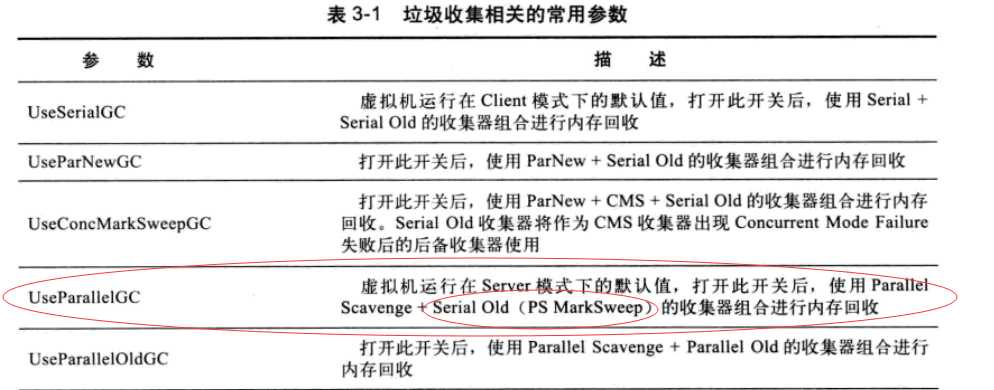
通过参数选择需要使用的垃圾收集器
<font style="color:rgb(51, 51, 51);">-XX:+UseSerialGC</font>,虚拟机运行在Client模式下的默认值,Serial+Serial Old。<font style="color:rgb(51, 51, 51);">-XX:+UseParNewGC</font>,ParNew+Serial Old,在JDK1.8被废弃,在JDK1.7还可以使用。<font style="color:rgb(51, 51, 51);">-XX:+UseConcMarkSweepGC</font>,ParNew+CMS+Serial Old。<font style="color:rgb(51, 51, 51);">-XX:+UseParallelGC</font>,虚拟机运行在Server模式下的默认值,Parallel Scavenge+Serial Old(PS Mark Sweep)。<font style="color:rgb(51, 51, 51);">-XX:+UseParallelOldGC</font>,Parallel Scavenge+Parallel Old。<font style="color:rgb(51, 51, 51);">-XX:+UseG1GC</font>,G1+G1。
1.2、分区收集策略
JDK7/8使用采用分代收集比较多的垃圾收集器组合
另外随着JDK版本更新,JDK9之后默认的垃圾收集器为G1,之前分代收集思想逐渐被分区收集思想代替,考虑的是收集堆内存的哪个部分才能获得收益最大,如G1、ZGC-JDK15开始准备好生产了、Shenandoah,并且随着JDK的版本的升级吞吐量、响应速度都在不断优化提升。
- G1:开创了垃圾收集器面向局部收集的设计思路 和 基于Region的内存布局形式。不再像之前那样划代,而是把连续的堆内存划分为一块块的Region,每一个Region都可以根据需要充当之前分代区域的Eden、Survivor、老年代空间,除此之外还有一类特殊的Humongous区域专门用于存储大对象。它可以面向堆内存任何部分来组成回收集(Collection Set),衡量标准不再是它属于哪个分代,而是哪块内存中存放的垃圾数量最多,回收收益最大,优先处理回收收益最大的那些 Region,这也就是 Garbage First 名字的由来。
- Shennandoah:一款RedHat独立开发后来贡献给OpenJDK的收集器,在OracleJDK不存在,目标之一是暂停时间与堆大小无关,并且经过优化,中断时间不超过几毫秒。
- ZGC:目标和Shennandoah类似,希望在对吞吐量影响不大的情况下(相比G1应用程序吞吐量减少不超过15%),实现任意堆内存大小都可以吧垃圾收集器停顿时间限制在十毫秒内。
深入学习参考
1.3、为什么CMS从来没成为默认收集器
CMS(Concurrent Mark Sweep)是一种 以获取最短回收停顿时间为目标 的收集器。
在 JDK 5 发布时,HotSpot 虚拟机推出了一款在强交互应用中具有划时代意义的垃圾收集器——CMS 收集器。这款收集器是 HotSpot 中第一款真正意义上支持并发的垃圾收集器,它首次实现了让垃圾收集线程与用户线程(基本上)同时工作。
CMS 比 G1 早不了多少。CMS 从 JDK 5 开始加入,6 成熟;而 G1 是 7 加入,8 成熟,9 正式成为默认 GC 策略。此时 CMS 就被标记为 Deprecated,随后在 JDK 14 中被移除。
CMS并不是一个非常成功的GC策略,GC优化一般考虑点是吞吐量和响应时间,而CMS
- 采用标记-清除算法,当处理器核比较少的时候,会造成比较大的负载,而且容易产生内存碎片,碎片太多无能为力的时候触发Concurrent Mode Failure还需要Serial Old来擦屁股。
- 仅针对老年代,还需要一个新生代收集器,但是和Parallel Scavenage又不兼容,只能选择性能不如Parallel Scavenage的PerNew。
- 需要调整的参数比较多,比G1多一倍
以上的种种,造成的结果就是 ParNew + CMS + Serial Old 的组合工作起来其实并不稳定。为了得到 CMS 那一点好处,需要付出很多的代价(包括 JVM 调参)。
CMS 相比前辈们,没有带来革命性的改变;而它的后辈们比它强太多。它自身的实现又很复杂,兼容性又差,调参也很麻烦,所以无法成为默认 GC 方案了。
参考
2、查看JVM运行时环境
数据库环境是MySQL,连接池使用的是HikariPool,驱动是mysql-connector-java-8.0.21.jar,当前生产环境JVM运行参数
// 测试环境举例
root     14968     1  0 2月23 ?       00:41:51

java -server

-XX:MetaspaceSize=160m
-XX:MaxMetaspaceSize=160m
-Xms1024m
-Xmx1024m
-Xss256k
-Duser.timezone=GMT+08
-XX:+UseParNewGC
-XX:+UseConcMarkSweepGC
-XX:+CMSParallelRemarkEnabled
-XX:CMSInitiatingOccupancyFraction=80
-XX:+UseCMSInitiatingOccupancyOnly
-XX:+HeapDumpOnOutOfMemoryError
-XX:HeapDumpPath=/data/serviceroot/xkw-xopqbm-api-service/xkw-xopqbm-api-service.hprof
-XX:+PrintGCDetails
-XX:+PrintGCDateStamps
-Xloggc:/data/serviceroot/xkw-xopqbm-api-service/logs/xkw-xopqbm-api-service-gc.log
-XX:+UseGCLogFileRotation
-XX:NumberOfGCLogFiles=10
-XX:GCLogFileSize=1m

-jar /data/serviceroot/xkw-xopqbm-api-service/xkw-xopqbm-api-service.jar
--spring.profiles.active=test
--server.port=9501
-Dons.client.logLevel=ERROR


// 正式环境
nohup java -server

-jar /data/serviceroot/$SERVICE_DIR/$JAR_NAME
--spring.profiles.active=product
--server.port=9501 -Dons.client.logLevel=ERROR
--flakeIdGenerator.hostId=3 > /dev/null 2>&1 &
当前服务器的java版本为1.8
[root@localmdmtest ~]# java -version
java version "1.8.0_281"
Java(TM) SE Runtime Environment (build 1.8.0_281-b09)
Java HotSpot(TM) 64-Bit Server VM (build 25.281-b09, mixed mode)
查看使用的垃圾收集器 jmap -heap pid,可以看到当前使用的垃圾收集器 ParNew+CMS+Serial Old
[root@localmdmtest ~]# jmap -heap 14968

Attaching to process ID 14968, please wait...
Debugger attached successfully.
Server compiler detected.
JVM version is 25.281-b09

using parallel threads in the new generation.
using thread-local object allocation.


# Concurrent Mark-Sweep GC :CMS回收器
# Mark Sweep Compact GC:    串行GC(Serial GC)
# Parallel GC with 2 thread(s): 并行GC(ParNew)

# 这里看出是CMS
Concurrent Mark-Sweep GC

Heap Configuration:
   MinHeapFreeRatio         = 40
   MaxHeapFreeRatio         = 70
   MaxHeapSize              = 1073741824 (1024.0MB)
   NewSize                  = 357892096 (341.3125MB)
   MaxNewSize               = 357892096 (341.3125MB)
   OldSize                  = 715849728 (682.6875MB)
   NewRatio                 = 2
   SurvivorRatio            = 8
   MetaspaceSize            = 167772160 (160.0MB)
   CompressedClassSpaceSize = 159383552 (152.0MB)
   MaxMetaspaceSize         = 167772160 (160.0MB)
   G1HeapRegionSize         = 0 (0.0MB)

Heap Usage:
New Generation (Eden + 1 Survivor Space):
   capacity = 322109440 (307.1875MB)
   used     = 245758352 (234.37342834472656MB)
   free     = 76351088 (72.81407165527344MB)
   76.2965382200534% used
Eden Space:
   capacity = 286326784 (273.0625MB)
   used     = 239080888 (228.00530242919922MB)
   free     = 47245896 (45.05719757080078MB)
   83.49930965592098% used
From Space:
   capacity = 35782656 (34.125MB)
   used     = 6677464 (6.368125915527344MB)
   free     = 29105192 (27.756874084472656MB)
   18.66117484403617% used
To Space:
   capacity = 35782656 (34.125MB)
   used     = 0 (0.0MB)
   free     = 35782656 (34.125MB)
   0.0% used
concurrent mark-sweep generation:
   capacity = 715849728 (682.6875MB)
   used     = 84539240 (80.6229019165039MB)
   free     = 631310488 (602.0645980834961MB)
   11.809634996466745% used

45864 interned Strings occupying 4725904 bytes.
3、分析快照
dump快照命令:jmap -dump:live,format=b,file=/home/scl/xopqbm/heapdump.hprof xxx
可以使用MAT或者在线工具https://heaphero.io/分析快照,发现11,319 instances of "com.mysql.cj.jdbc.AbandonedConnectionCleanupThread$ConnectionFinalizerPhantomReference"
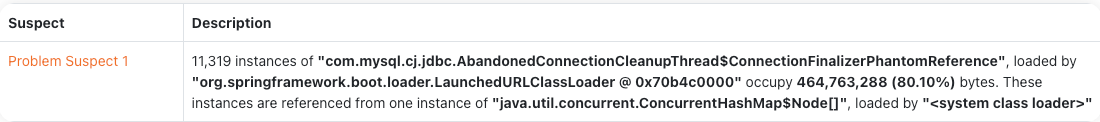
也就是ConnectionFinalizerPhantomReference占了80%的堆内存,为什么会这么多对象,需要分析下原因。
AbandonedConnectionCleanupThread类是 MySQL JDBC 驱动中用于清理被遗弃连接的线程类。这个类主要用于防止数据库连接泄露,通过在后台运行来清理那些没有正确关闭的数据库连接。
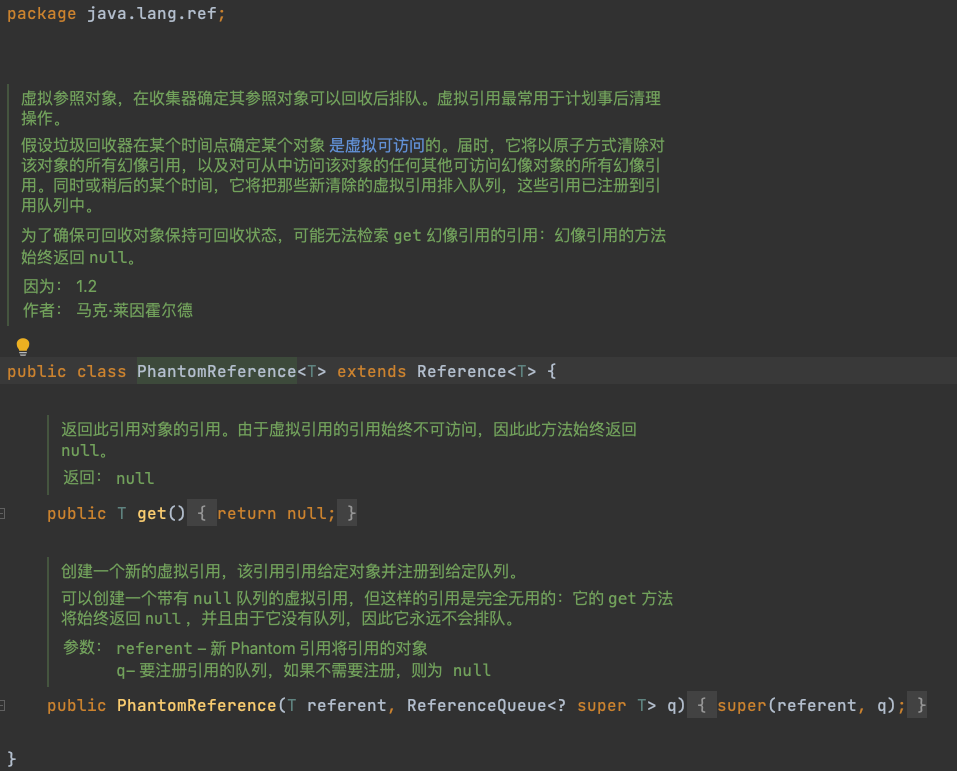
3.1、PhantomReference虚引用
分析之前需要先知道虚引用的概念,分析的是mysql-connector-java-8.0.21.jar下的包com.mysql.cj.jdbc
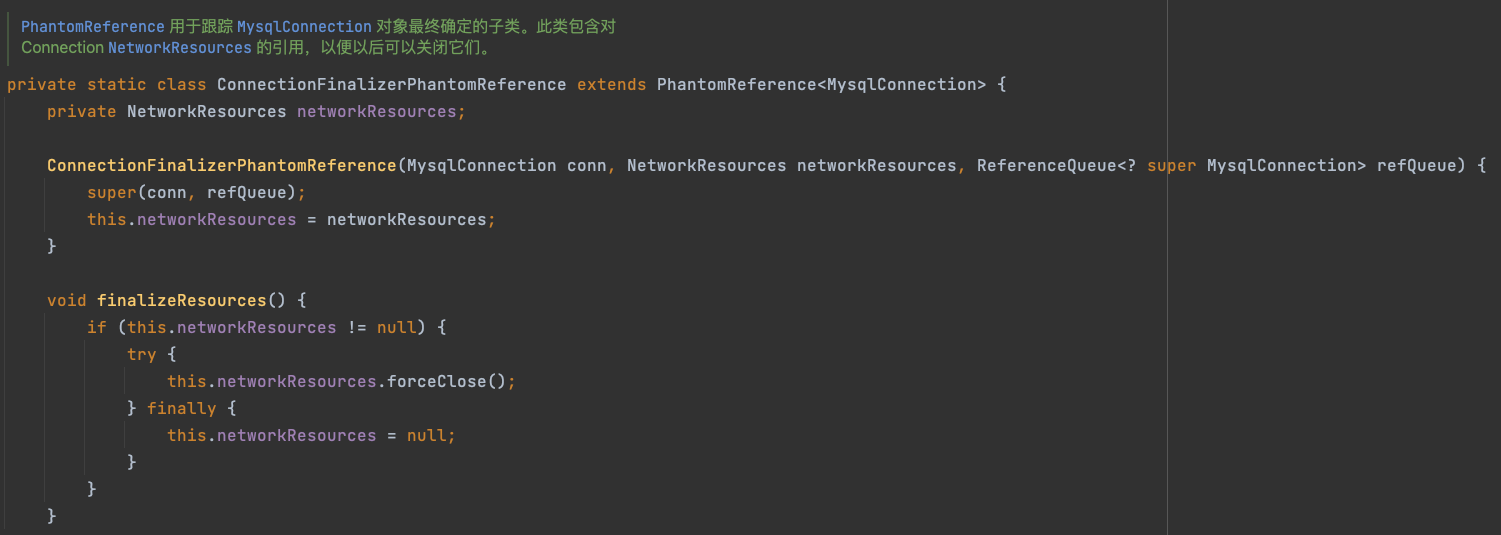
ConnectionFinalizerPhantomReference这个类在AbandonedConnectionCleanupThread�类内定义,继承PhantomReference,PhantomReference是JVM四大引用之一虚引用
// AbandonedConnectionCleanupThread类内
private static class ConnectionFinalizerPhantomReference extends PhantomReference<MysqlConnection> {
        private NetworkResources networkResources;

        ConnectionFinalizerPhantomReference(MysqlConnection conn, NetworkResources networkResources, ReferenceQueue<? super MysqlConnection> refQueue) {
            super(conn, refQueue);
            this.networkResources = networkResources;
        }

        // 销毁资源
        void finalizeResources() {
            if (this.networkResources != null) {
                try {
                    this.networkResources.forceClose();
                } finally {
                    this.networkResources = null;
                }
            }
        }
    }
虚引用也称为“幽灵引用”,它是最弱的一种引用关系。对于PhantomReference虚引用的概念,简单就是他可以将某个对象标记,一般和虚引用队列配合使用,一般用于检测标记对象是否被GC回收,当虚引用对象被GC标记可回收的时候,在回收之前,该对象会被放入虚引用队列,
- 如果一个对象仅持有虚引用,那么它就和没有任何引用一样,在任何时候都可能被垃圾回收器回收。
- 为一个对象设置虚引用关联的唯一目的只是为了能在这个对象被收集器回收时收到一个系统通知。当垃圾回收器准备回收一个对象时,如果发现它还有虚引用,就会在垃圾回收后,将这个虚引用加入引用队列,在其关联的虚引用出队前,不会彻底销毁该对象。所以可以通过检查引用队列中是否有相应的虚引用来判断对象是否已经被回收了。
虚引用理解demo1
static ReferenceQueue<Object> queue = new ReferenceQueue<>();

public static void main(String[] args) throws InterruptedException {
    PhantomReference<Object> phantomReference = buildReference();
    System.gc();Thread.sleep(100);
    System.out.println(queue.poll());
}

public static PhantomReference<Object> buildReference() {
    Object o = new Object();
    // 绑定对象和虚引用队列
    return new PhantomReference<>(o, queue);
}
虚引用理解demo2
ps:需要注意在不同的垃圾收集器可能导致结果不太一样,下面分别使用Java11默认的G1收集器以及参数指定 ParNew+CMS+Serial Old 测试下面代码,提前开启GC日志
 public void test(){

        MonitorInfoTest monitorInfoTest = new MonitorInfoTest();
        System.out.println("1 ===========>");
        monitorInfoTest.printMemoryInfo();

        ReferenceQueue<byte[]> queue = new ReferenceQueue<>();
        PhantomReference<byte[]> phantomReference = new PhantomReference<>(
            new byte[1024 * 1024 * 2], queue);

        System.out.println("2 ===========>");
        monitorInfoTest.printMemoryInfo();
        System.gc();
        try {
            Thread.sleep(100L);
        } catch (InterruptedException e) {
            throw new RuntimeException(e);
        }

        System.out.println("虚引用队列元素:" + queue.poll());
        // phantomReference = null;

        System.out.println("3 ===========>");
        monitorInfoTest.printMemoryInfo();

        byte[] data = new byte[1024 * 1024 * 7];

        System.out.println("4 ===========>");
        monitorInfoTest.printMemoryInfo();

    }
测试G1 FullGC虚引用回收
java11默认的垃圾收集器是G1
-Xms10m
-Xmx10m
-XX:+PrintGCDetails
可以看到System.gc()执行一次FullGC的时候,虚引用对象进入虚引用队列,被标记为老年代区域,然后对象被回收,并且内存已经被释放。
- GC(0) Eden regions: 3->0(4):表示 Eden 区域的变化,从 3 个变为 0 个(总共有 4 个)。
- GC(0) Survivor regions: 0->0(0):表示 Survivor 区域的变化,从 0 个变为 0 个(总共有 0 个)。
- GC(0) Old regions: 0->1:表示 Old 区域的变化,从 0 个变为 1 个。
- GC(0) Humongous regions: 3->0:表示 Humongous 区域的变化,从 3 个变为 0 个。
- GC(0) Pause Full (System.gc()) 5M->0M(10M) 7.249ms:表示 Full GC 完成,回收了 5M 的内存,将内存从 5M 变为 0M(总共有 10M),耗时 7.249 毫秒。
/Library/Java/JavaVirtualMachines/jdk-11.0.2.jdk/Contents/Home/bin/java -Xms10m -Xmx10m -XX:+PrintGCDetails -javaagent:/Applications/IntelliJ IDEA.app/Contents/lib/idea_rt.jar=54241:/Applications/IntelliJ IDEA.app/Contents/bin -Dfile.encoding=UTF-8 -classpath /Users/sichaolong/Documents/my_projects/my_github_projects/learn-projects-demo/simple-java-code/analysize-mysql-phantomreference-demo/target/classes org.example.PhantomReferenceTest
[0.004s][warning][gc] -XX:+PrintGCDetails is deprecated. Will use -Xlog:gc* instead.
[0.013s][info   ][gc,heap] Heap region size: 1M
[0.014s][info   ][gc     ] Using G1
[0.014s][info   ][gc,heap,coops] Heap address: 0x00000007ff600000, size: 10 MB, Compressed Oops mode: Zero based, Oop shift amount: 3
1 ===========>
JVM内存已用的空间为:1.7238235473632812 MB
JVM内存的空闲空间为:8.276176452636719 MB
JVM总内存空间为:10.0 MB
JVM总内存空间为:10.0 MB
2 ===========>
JVM内存已用的空间为:5.1620330810546875 MB
JVM内存的空闲空间为:4.8379669189453125 MB
JVM总内存空间为:10.0 MB
JVM总内存空间为:10.0 MB
[0.236s][info   ][gc,task      ] GC(0) Using 1 workers of 8 for full compaction
[0.236s][info   ][gc,start     ] GC(0) Pause Full (System.gc())
[0.236s][info   ][gc,phases,start] GC(0) Phase 1: Mark live objects
[0.240s][info   ][gc,stringtable ] GC(0) Cleaned string and symbol table, strings: 2727 processed, 4 removed, symbols: 27362 processed, 0 removed
[0.240s][info   ][gc,phases      ] GC(0) Phase 1: Mark live objects 4.692ms
[0.240s][info   ][gc,phases,start] GC(0) Phase 2: Prepare for compaction
[0.241s][info   ][gc,phases      ] GC(0) Phase 2: Prepare for compaction 0.410ms
[0.241s][info   ][gc,phases,start] GC(0) Phase 3: Adjust pointers
[0.242s][info   ][gc,phases      ] GC(0) Phase 3: Adjust pointers 1.401ms
[0.242s][info   ][gc,phases,start] GC(0) Phase 4: Compact heap
[0.243s][info   ][gc,phases      ] GC(0) Phase 4: Compact heap 0.424ms
[0.243s][info   ][gc,heap        ] GC(0) Eden regions: 3->0(4)
[0.243s][info   ][gc,heap        ] GC(0) Survivor regions: 0->0(0)
[0.243s][info   ][gc,heap        ] GC(0) Old regions: 0->1
[0.243s][info   ][gc,heap        ] GC(0) Humongous regions: 3->0
[0.243s][info   ][gc,metaspace   ] GC(0) Metaspace: 6863K->6863K(1056768K)
[0.243s][info   ][gc             ] GC(0) Pause Full (System.gc()) 5M->0M(10M) 7.249ms
[0.243s][info   ][gc,cpu         ] GC(0) User=0.01s Sys=0.00s Real=0.00s
3 ===========>
JVM内存已用的空间为:0.998626708984375 MB
JVM内存的空闲空间为:9.001373291015625 MB
JVM总内存空间为:10.0 MB
JVM总内存空间为:10.0 MB
虚引用队列元素:java.lang.ref.PhantomReference@3fb6a447
4 ===========>
JVM内存已用的空间为:1.1987075805664062 MB
JVM内存的空闲空间为:8.801292419433594 MB
JVM总内存空间为:10.0 MB
JVM总内存空间为:10.0 MB
[0.376s][info   ][gc,start       ] GC(1) Pause Young (Concurrent Start) (G1 Humongous Allocation)
[0.376s][info   ][gc,task        ] GC(1) Using 2 workers of 8 for evacuation
[0.377s][info   ][gc,phases      ] GC(1)   Pre Evacuate Collection Set: 0.0ms
[0.377s][info   ][gc,phases      ] GC(1)   Evacuate Collection Set: 0.9ms
[0.377s][info   ][gc,phases      ] GC(1)   Post Evacuate Collection Set: 0.2ms
[0.377s][info   ][gc,phases      ] GC(1)   Other: 0.3ms
[0.377s][info   ][gc,heap        ] GC(1) Eden regions: 1->0(3)
[0.377s][info   ][gc,heap        ] GC(1) Survivor regions: 0->1(1)
[0.377s][info   ][gc,heap        ] GC(1) Old regions: 1->1
[0.377s][info   ][gc,heap        ] GC(1) Humongous regions: 0->0
[0.377s][info   ][gc,metaspace   ] GC(1) Metaspace: 6907K->6907K(1056768K)
[0.377s][info   ][gc             ] GC(1) Pause Young (Concurrent Start) (G1 Humongous Allocation) 1M->0M(10M) 1.410ms
[0.377s][info   ][gc,cpu         ] GC(1) User=0.00s Sys=0.00s Real=0.00s
[0.378s][info   ][gc             ] GC(2) Concurrent Cycle
[0.378s][info   ][gc,marking     ] GC(2) Concurrent Clear Claimed Marks
[0.378s][info   ][gc,marking     ] GC(2) Concurrent Clear Claimed Marks 0.012ms
[0.378s][info   ][gc,marking     ] GC(2) Concurrent Scan Root Regions
[0.378s][info   ][gc,marking     ] GC(2) Concurrent Scan Root Regions 0.069ms
[0.378s][info   ][gc,marking     ] GC(2) Concurrent Mark (0.378s)
[0.378s][info   ][gc,marking     ] GC(2) Concurrent Mark From Roots
[0.378s][info   ][gc,task        ] GC(2) Using 2 workers of 2 for marking
[0.380s][info   ][gc,marking     ] GC(2) Concurrent Mark From Roots 1.839ms
[0.380s][info   ][gc,marking     ] GC(2) Concurrent Preclean
[0.380s][info   ][gc,marking     ] GC(2) Concurrent Preclean 0.093ms
[0.380s][info   ][gc,marking     ] GC(2) Concurrent Mark (0.378s, 0.380s) 2.069ms
[0.380s][info   ][gc,start       ] GC(2) Pause Remark
[0.383s][info   ][gc,stringtable ] GC(2) Cleaned string and symbol table, strings: 2735 processed, 0 removed, symbols: 27411 processed, 0 removed
[0.383s][info   ][gc             ] GC(2) Pause Remark 6M->6M(10M) 3.195ms
[0.383s][info   ][gc,cpu         ] GC(2) User=0.00s Sys=0.00s Real=0.00s
[0.383s][info   ][gc,marking     ] GC(2) Concurrent Rebuild Remembered Sets
[0.384s][info   ][gc,marking     ] GC(2) Concurrent Rebuild Remembered Sets 0.907ms
[0.384s][info   ][gc,start       ] GC(2) Pause Cleanup
[0.384s][info   ][gc             ] GC(2) Pause Cleanup 6M->6M(10M) 0.048ms
[0.384s][info   ][gc,cpu         ] GC(2) User=0.00s Sys=0.00s Real=0.00s
[0.384s][info   ][gc,marking     ] GC(2) Concurrent Cleanup for Next Mark
[0.384s][info   ][gc,marking     ] GC(2) Concurrent Cleanup for Next Mark 0.058ms
[0.384s][info   ][gc             ] GC(2) Concurrent Cycle 6.782ms
[0.384s][info   ][gc,heap,exit   ] Heap
[0.384s][info   ][gc,heap,exit   ]  garbage-first heap   total 10240K, used 6108K [0x00000007ff600000, 0x0000000800000000)
[0.384s][info   ][gc,heap,exit   ]   region size 1024K, 2 young (2048K), 1 survivors (1024K)
[0.384s][info   ][gc,heap,exit   ]  Metaspace       used 6923K, capacity 7028K, committed 7168K, reserved 1056768K
[0.384s][info   ][gc,heap,exit   ]   class space    used 625K, capacity 659K, committed 768K, reserved 1048576K

Process finished with exit code 0
测试CMS FullGC虚引用回收
下面是ParNew + CMS
-Xms10m -Xmx10m
-XX:+PrintGCDetails
-XX:+UseConcMarkSweepGC
-XX:+CMSParallelRemarkEnabled
-XX:CMSInitiatingOccupancyFraction=80
-XX:+UseCMSInitiatingOccupancyOnly
-XX:+PrintCommandLineFlags
堆内存新生代:老年代 = 1:2,总共10M
- 新生代总容量为 3072K
- 老年代总容量为 6848K
(1)第一次执行一次FullGC,代码调用System.gc()导致
- ParNew: 2419K->0K(3072K):在新生代中,使用 ParNew 垃圾回收器,回收前新生代占用 2419K,回收后新生代占用降为 0K,新生代总容量为 3072K。
- CMS: 700K->952K(6848K):在老年代中,使用 CMS 垃圾回收器,回收前老年代占用 700K,回收后老年代占用增加到 952K,老年代总容量为 6848K。这种占用增加的情况可能是因为在 GC 过程中,一些存活的对象从新生代晋升到了老年代。
本次FullGC,GC 前堆内存占用约为 3M,GC 后堆内存占用降为 0M,发现虚引用对象内存直接被释放了,虚引用对象进入了队列,堆内存的总容量为 10M。
(2)第二次执行Young GC,在虚拟机运行时间约 0.354 秒时,因为要申请6M的空间,新生代中的空间不足(Allocation Failure),触发了一次年轻代(Young Generation)的 GC。
- 使用了 2 个工作线程进行垃圾回收。
- 新生代使用的是 ParNew 垃圾回收器,回收前新生代占用 237K,回收后新生代占用降为 0K,新生代总容量为 3072K。
- 老年代使用的是 CMS 垃圾回收器,回收前老年代占用 952K,回收后老年代占用增加到 972K,老年代总容量为 6848K。
(3)第三次执行FullGC,紧接着第二次YoungGC,在同一时间(0.354s)也触发了一次 Full GC,原因同样是 Allocation Failure。
- Full GC 包括标记存活对象、计算新对象地址、调整指针和移动对象等阶段。
- 这次 Full GC 导致的暂停时间为 4.941 毫秒,堆内存从 1M 降至 0M,总容量为 9M。
最后老年代6848K剩余的空间放不下7M,触发OOM。
/Library/Java/JavaVirtualMachines/jdk-11.0.2.jdk/Contents/Home/bin/java -Xms10m -Xmx10m -XX:+PrintGCDetails -XX:+UseConcMarkSweepGC -XX:+CMSParallelRemarkEnabled -XX:CMSInitiatingOccupancyFraction=80 -XX:+UseCMSInitiatingOccupancyOnly -XX:+PrintCommandLineFlags -javaagent:/Applications/IntelliJ IDEA.app/Contents/lib/idea_rt.jar=55007:/Applications/IntelliJ IDEA.app/Contents/bin -Dfile.encoding=UTF-8 -classpath /Users/sichaolong/Documents/my_projects/my_github_projects/learn-projects-demo/simple-java-code/analysize-mysql-phantomreference-demo/target/classes org.example.PhantomReferenceTest
Java HotSpot(TM) 64-Bit Server VM warning: Option UseConcMarkSweepGC was deprecated in version 9.0 and will likely be removed in a future release.
[0.004s][warning][gc] -XX:+PrintGCDetails is deprecated. Will use -Xlog:gc* instead.
-XX:CMSInitiatingOccupancyFraction=80 -XX:+CMSParallelRemarkEnabled -XX:InitialHeapSize=10485760 -XX:MaxHeapSize=10485760 -XX:MaxNewSize=3497984 -XX:MaxTenuringThreshold=6 -XX:NewSize=3497984 -XX:OldSize=6987776 -XX:+PrintCommandLineFlags -XX:+PrintGCDetails -XX:ReservedCodeCacheSize=251658240 -XX:+SegmentedCodeCache -XX:+UseCMSInitiatingOccupancyOnly -XX:+UseCompressedClassPointers -XX:+UseCompressedOops -XX:+UseConcMarkSweepGC
[0.014s][info   ][gc] Using Concurrent Mark Sweep
[0.014s][info   ][gc,heap,coops] Heap address: 0x00000007ff600000, size: 10 MB, Compressed Oops mode: Zero based, Oop shift amount: 3
1 ===========>
JVM内存已用的空间为:1.5864715576171875 MB
JVM内存的空闲空间为:8.101028442382812 MB
JVM总内存空间为:9.6875 MB
JVM总内存空间为:9.6875 MB
[0.225s][info   ][gc,start     ] GC(0) Pause Young (Allocation Failure)
[0.225s][info   ][gc,task      ] GC(0) Using 2 workers of 8 for evacuation
[0.231s][info   ][gc,heap      ] GC(0) ParNew: 2137K->318K(3072K)
[0.231s][info   ][gc,heap      ] GC(0) CMS: 0K->701K(6848K)
[0.231s][info   ][gc,metaspace ] GC(0) Metaspace: 6858K->6858K(1056768K)
[0.231s][info   ][gc           ] GC(0) Pause Young (Allocation Failure) 2M->0M(9M) 6.032ms
[0.231s][info   ][gc,cpu       ] GC(0) User=0.01s Sys=0.01s Real=0.01s
2 ===========>
JVM内存已用的空间为:3.0459365844726562 MB
JVM内存的空闲空间为:6.641563415527344 MB
JVM总内存空间为:9.6875 MB
JVM总内存空间为:9.6875 MB
[0.232s][info   ][gc,start     ] GC(1) Pause Full (System.gc())
[0.232s][info   ][gc,phases,start] GC(1) Phase 1: Mark live objects
[0.234s][info   ][gc,phases      ] GC(1) Phase 1: Mark live objects 1.359ms
[0.234s][info   ][gc,phases,start] GC(1) Phase 2: Compute new object addresses
[0.234s][info   ][gc,phases      ] GC(1) Phase 2: Compute new object addresses 0.407ms
[0.234s][info   ][gc,phases,start] GC(1) Phase 3: Adjust pointers
[0.237s][info   ][gc,phases      ] GC(1) Phase 3: Adjust pointers 2.904ms
[0.237s][info   ][gc,phases,start] GC(1) Phase 4: Move objects
[0.237s][info   ][gc,phases      ] GC(1) Phase 4: Move objects 0.301ms
[0.237s][info   ][gc,heap        ] GC(1) ParNew: 2417K->0K(3072K)
[0.237s][info   ][gc,heap        ] GC(1) CMS: 701K->952K(6848K)
[0.238s][info   ][gc,metaspace   ] GC(1) Metaspace: 6859K->6859K(1056768K)
[0.238s][info   ][gc             ] GC(1) Pause Full (System.gc()) 3M->0M(9M) 5.295ms
[0.238s][info   ][gc,cpu         ] GC(1) User=0.00s Sys=0.00s Real=0.00s
虚引用队列元素:java.lang.ref.PhantomReference@3fb6a447
3 ===========>
JVM内存已用的空间为:1.161224365234375 MB
JVM内存的空闲空间为:8.526275634765625 MB
JVM总内存空间为:9.6875 MB
JVM总内存空间为:9.6875 MB
[0.367s][info   ][gc,start       ] GC(2) Pause Young (Allocation Failure)
[0.367s][info   ][gc,task        ] GC(2) Using 2 workers of 8 for evacuation
[0.368s][info   ][gc,start       ] GC(3) Pause Full (Allocation Failure)
[0.368s][info   ][gc,phases,start] GC(3) Phase 1: Mark live objects
[0.369s][info   ][gc,phases      ] GC(3) Phase 1: Mark live objects 1.189ms
[0.369s][info   ][gc,phases,start] GC(3) Phase 2: Compute new object addresses
[0.369s][info   ][gc,phases      ] GC(3) Phase 2: Compute new object addresses 0.342ms
[0.369s][info   ][gc,phases,start] GC(3) Phase 3: Adjust pointers
[0.372s][info   ][gc,phases      ] GC(3) Phase 3: Adjust pointers 3.131ms
[0.373s][info   ][gc,phases,start] GC(3) Phase 4: Move objects
[0.373s][info   ][gc,phases      ] GC(3) Phase 4: Move objects 0.252ms
[0.373s][info   ][gc             ] GC(3) Pause Full (Allocation Failure) 1M->0M(9M) 5.298ms
[0.373s][info   ][gc,heap        ] GC(2) ParNew: 236K->0K(3072K)
[0.373s][info   ][gc,heap        ] GC(2) CMS: 952K->972K(6848K)
[0.373s][info   ][gc,metaspace   ] GC(2) Metaspace: 6911K->6911K(1056768K)
[0.373s][info   ][gc             ] GC(2) Pause Young (Allocation Failure) 1M->0M(9M) 6.022ms
[0.373s][info   ][gc,cpu         ] GC(2) User=0.01s Sys=0.00s Real=0.01s
[0.373s][info   ][gc,start       ] GC(4) Pause Full (Allocation Failure)
[0.373s][info   ][gc,phases,start] GC(4) Phase 1: Mark live objects
[0.374s][info   ][gc,phases      ] GC(4) Phase 1: Mark live objects 1.392ms
[0.374s][info   ][gc,phases,start] GC(4) Phase 2: Compute new object addresses
[0.375s][info   ][gc,phases      ] GC(4) Phase 2: Compute new object addresses 0.336ms
[0.375s][info   ][gc,phases,start] GC(4) Phase 3: Adjust pointers
[0.376s][info   ][gc,phases      ] GC(4) Phase 3: Adjust pointers 0.785ms
[0.376s][info   ][gc,phases,start] GC(4) Phase 4: Move objects
[0.376s][info   ][gc,phases      ] GC(4) Phase 4: Move objects 0.243ms
[0.376s][info   ][gc,heap        ] GC(4) ParNew: 0K->0K(3072K)
[0.376s][info   ][gc,heap        ] GC(4) CMS: 972K->934K(6848K)
[0.376s][info   ][gc,metaspace   ] GC(4) Metaspace: 6911K->6911K(1056768K)
[0.376s][info   ][gc             ] GC(4) Pause Full (Allocation Failure) 0M->0M(9M) 2.858ms
[0.376s][info   ][gc,cpu         ] GC(4) User=0.00s Sys=0.00s Real=0.00s
[0.378s][info   ][gc,heap,exit   ] Heap
[0.378s][info   ][gc,heap,exit   ]  par new generation   total 3072K, used 80K [0x00000007ff600000, 0x00000007ff950000, 0x00000007ff950000)
[0.378s][info   ][gc,heap,exit   ]   eden space 2752K,   2% used [0x00000007ff600000, 0x00000007ff614070, 0x00000007ff8b0000)
[0.378s][info   ][gc,heap,exit   ]   from space 320K,   0% used [0x00000007ff8b0000, 0x00000007ff8b0000, 0x00000007ff900000)
[0.378s][info   ][gc,heap,exit   ]   to   space 320K,   0% used [0x00000007ff900000, 0x00000007ff900000, 0x00000007ff950000)
[0.378s][info   ][gc,heap,exit   ]  concurrent mark-sweep generation total 6848K, used 934K [0x00000007ff950000, 0x0000000800000000, 0x0000000800000000)
[0.378s][info   ][gc,heap,exit   ]  Metaspace       used 6900K, capacity 6975K, committed 7168K, reserved 1056768K
[0.378s][info   ][gc,heap,exit   ]   class space    used 615K, capacity 640K, committed 768K, reserved 1048576K
Exception in thread "main" java.lang.OutOfMemoryError: Java heap space
	at org.example.PhantomReferenceTest.test(PhantomReferenceTest.java:44)
	at org.example.PhantomReferenceTest.main(PhantomReferenceTest.java:15)

Process finished with exit code 1
以上验证CMS垃圾收集器FullGC的时候虚引用对象移动到虚引用队列,而且内存会被释放。
测试CMS MinorGC虚引用回收
下面是ParNew + CMS
-Xms10m -Xmx10m
-XX:+PrintGCDetails
-XX:+UseConcMarkSweepGC
-XX:+CMSParallelRemarkEnabled
-XX:CMSInitiatingOccupancyFraction=80
-XX:+UseCMSInitiatingOccupancyOnly
-XX:+PrintCommandLineFlags
虚引用理解demo3
public void test(){
    MonitorInfoTest monitorInfoTest = new MonitorInfoTest();
    System.out.println("1 ===========>");
    monitorInfoTest.printMemoryInfo();

    ReferenceQueue<byte[]> queue = new ReferenceQueue<>();
    PhantomReference<byte[]> phantomReference = new PhantomReference<>(
        new byte[1024 * 1024 * 2], queue);

    PhantomReference<byte[]> phantomReference2 = new PhantomReference<>(
        new byte[1024 * 1024 * 2], queue);

    System.out.println("2 ===========>");
    monitorInfoTest.printMemoryInfo();
    // System.gc();
    try {
        Thread.sleep(100L);
    } catch (InterruptedException e) {
        throw new RuntimeException(e);
    }

    System.out.println("虚引用队列元素:" + queue.poll());
    //         phantomReference = null;
    //         phantomReference2 = null;
    System.out.println("3 ===========>");
    monitorInfoTest.printMemoryInfo();

    byte[] data = new byte[1024 * 1024 * 4];
    // 如果是 byte[] data = new byte[1024 * 1024 * 2],即使不发生FullGC,但是也会清理一个虚引用对象
    // 如果是 byte[] data = new byte[1024 * 1024 * 3],即使不发生FullGC,也不会清理虚引用对象
    // 但是换成 byte[] data = new byte[1024 * 1024 * 4],会发生FullGC,会清理虚引用对象

    System.out.println("虚引用队列元素1:" + queue.poll());
    System.out.println("虚引用队列元素2:" + queue.poll());

    System.out.println("4 ===========>");
    monitorInfoTest.printMemoryInfo();


}
堆内存新生代:老年代 = 1:2,
(1)第一次执行一次YoungGC,因为创建了两个2M的虚引用对象,第一个对象先进入伊甸园,放入第一个1M的时候,超过伊甸园阈值(默认50%),需要进行一次YoungGC
- GC(0) ParNew: 2138K->320K(3072K)`:在垃圾回收之后,年轻代中的ParNew收集器将使用的内存从2138K减少到320K,年轻代的总大小为3072K。
- C(0) CMS: 0K-> 702K(6848K)`:在垃圾回收之后,老年代(CMS收集器管理的部分)中的使用内存从0K增加到702K,老年代的总大小为6848K。
- GC(0) Pause Young (Allocation Failure) 2M-> 0M(9M) 5.776ms`:这次年轻代垃圾回收将堆内存从大约2M减少到320K,堆的总大小为9M,垃圾回收耗时5.776毫秒。
(2)第二次执行一次YoungGC,和第一个对象同理,伊甸园占用空间超过阈值
- GC(1) ParNew: 2419K->141K(3072K):表示年轻代的垃圾回收(ParNew)前后的内存使用情况,2419K表示回收前的已使用内存,141K表示回收后的已使用内存,3072K表示年轻代的总内存大小。
- GC(1) CMS: 702K->3070K(6848K):表示老年代(CMS)的垃圾回收前后的内存使用情况,702K表示回收前的已使用内存,3070K表示回收后的已使用内存,6848K表示老年代的总内存大小。
此时虚引用对象已进入老年代,虚引用队列也没这两个虚引用对象,证明前两次YoungGC不会回收虚引用对象,也不会释放内存。
(3)第三次执行一次FullGC,虚引用进入虚引用队列,进行虚引用垃圾回收,释放内存
- 类型:分配失败(Allocation Failure)导致年轻代垃圾回收(Pause Young)
- 时间:发生在虚拟机启动后大约0.357秒
- 结果:
- ParNew区:从2429K减少到0K(总容量3072K)
- CMS区:从3070K减少到973K(总容量6848K)
- 类型:分配失败(Allocation Failure)导致完全垃圾回收(Pause Full)
- 时间:发生在虚拟机启动后大约0.358秒
- 结果:从3M减少到0M(总容量9M)
- 耗时:大约5.944毫秒
/Library/Java/JavaVirtualMachines/jdk-11.0.2.jdk/Contents/Home/bin/java -Xms10m -Xmx10m -XX:+PrintGCDetails -XX:+UseConcMarkSweepGC -XX:+CMSParallelRemarkEnabled -XX:CMSInitiatingOccupancyFraction=80 -XX:+UseCMSInitiatingOccupancyOnly -XX:+PrintCommandLineFlags -javaagent:/Applications/IntelliJ IDEA.app/Contents/lib/idea_rt.jar=55994:/Applications/IntelliJ IDEA.app/Contents/bin -Dfile.encoding=UTF-8 -classpath /Users/sichaolong/Documents/my_projects/my_github_projects/learn-projects-demo/simple-java-code/analysize-mysql-phantomreference-demo/target/classes org.example.PhantomReferenceTest
Java HotSpot(TM) 64-Bit Server VM warning: Option UseConcMarkSweepGC was deprecated in version 9.0 and will likely be removed in a future release.
[0.003s][warning][gc] -XX:+PrintGCDetails is deprecated. Will use -Xlog:gc* instead.
-XX:CMSInitiatingOccupancyFraction=80 -XX:+CMSParallelRemarkEnabled -XX:InitialHeapSize=10485760 -XX:MaxHeapSize=10485760 -XX:MaxNewSize=3497984 -XX:MaxTenuringThreshold=6 -XX:NewSize=3497984 -XX:OldSize=6987776 -XX:+PrintCommandLineFlags -XX:+PrintGCDetails -XX:ReservedCodeCacheSize=251658240 -XX:+SegmentedCodeCache -XX:+UseCMSInitiatingOccupancyOnly -XX:+UseCompressedClassPointers -XX:+UseCompressedOops -XX:+UseConcMarkSweepGC
[0.013s][info   ][gc] Using Concurrent Mark Sweep
[0.013s][info   ][gc,heap,coops] Heap address: 0x00000007ff600000, size: 10 MB, Compressed Oops mode: Zero based, Oop shift amount: 3
1 ===========>
JVM内存已用的空间为:1.5864715576171875 MB
JVM内存的空闲空间为:8.101028442382812 MB
JVM总内存空间为:9.6875 MB
JVM总内存空间为:9.6875 MB
[0.218s][info   ][gc,start     ] GC(0) Pause Young (Allocation Failure)
[0.219s][info   ][gc,task      ] GC(0) Using 2 workers of 8 for evacuation
[0.225s][info   ][gc,heap      ] GC(0) ParNew: 2137K->320K(3072K)
[0.225s][info   ][gc,heap      ] GC(0) CMS: 0K->702K(6848K)
[0.225s][info   ][gc,metaspace ] GC(0) Metaspace: 6840K->6840K(1056768K)
[0.225s][info   ][gc           ] GC(0) Pause Young (Allocation Failure) 2M->0M(9M) 6.494ms
[0.225s][info   ][gc,cpu       ] GC(0) User=0.00s Sys=0.00s Real=0.00s
[0.226s][info   ][gc,start     ] GC(1) Pause Young (Allocation Failure)
[0.226s][info   ][gc,task      ] GC(1) Using 2 workers of 8 for evacuation
[0.227s][info   ][gc,heap      ] GC(1) ParNew: 2419K->143K(3072K)
[0.227s][info   ][gc,heap      ] GC(1) CMS: 702K->3070K(6848K)
[0.227s][info   ][gc,metaspace ] GC(1) Metaspace: 6841K->6841K(1056768K)
[0.227s][info   ][gc           ] GC(1) Pause Young (Allocation Failure) 3M->3M(9M) 1.807ms
[0.227s][info   ][gc,cpu       ] GC(1) User=0.01s Sys=0.00s Real=0.00s
2 ===========>
JVM内存已用的空间为:5.1901397705078125 MB
JVM内存的空闲空间为:4.4973602294921875 MB
JVM总内存空间为:9.6875 MB
JVM总内存空间为:9.6875 MB
虚引用队列元素:null
3 ===========>
JVM内存已用的空间为:5.3710479736328125 MB
JVM内存的空闲空间为:4.3164520263671875 MB
JVM总内存空间为:9.6875 MB
JVM总内存空间为:9.6875 MB
[0.357s][info   ][gc,start     ] GC(2) Pause Young (Allocation Failure)
[0.357s][info   ][gc,task      ] GC(2) Using 2 workers of 8 for evacuation
[0.358s][info   ][gc,start     ] GC(3) Pause Full (Allocation Failure)
[0.358s][info   ][gc,phases,start] GC(3) Phase 1: Mark live objects
[0.359s][info   ][gc,phases      ] GC(3) Phase 1: Mark live objects 1.281ms
[0.359s][info   ][gc,phases,start] GC(3) Phase 2: Compute new object addresses
[0.359s][info   ][gc,phases      ] GC(3) Phase 2: Compute new object addresses 0.355ms
[0.359s][info   ][gc,phases,start] GC(3) Phase 3: Adjust pointers
[0.363s][info   ][gc,phases      ] GC(3) Phase 3: Adjust pointers 3.772ms
[0.363s][info   ][gc,phases,start] GC(3) Phase 4: Move objects
[0.363s][info   ][gc,phases      ] GC(3) Phase 4: Move objects 0.281ms
[0.364s][info   ][gc             ] GC(3) Pause Full (Allocation Failure) 3M->0M(9M) 5.944ms
[0.364s][info   ][gc,heap        ] GC(2) ParNew: 2429K->0K(3072K)
[0.364s][info   ][gc,heap        ] GC(2) CMS: 3070K->973K(6848K)
[0.364s][info   ][gc,metaspace   ] GC(2) Metaspace: 6918K->6918K(1056768K)
[0.364s][info   ][gc             ] GC(2) Pause Young (Allocation Failure) 5M->0M(9M) 6.761ms
[0.364s][info   ][gc,cpu         ] GC(2) User=0.00s Sys=0.00s Real=0.01s
虚引用队列元素1:java.lang.ref.PhantomReference@3fb6a447
虚引用队列元素2:java.lang.ref.PhantomReference@79b4d0f
4 ===========>
JVM内存已用的空间为:5.002433776855469 MB
JVM内存的空闲空间为:4.685066223144531 MB
JVM总内存空间为:9.6875 MB
JVM总内存空间为:9.6875 MB
[0.371s][info   ][gc,heap,exit   ] Heap
[0.371s][info   ][gc,heap,exit   ]  par new generation   total 3072K, used 80K [0x00000007ff600000, 0x00000007ff950000, 0x00000007ff950000)
[0.371s][info   ][gc,heap,exit   ]   eden space 2752K,   2% used [0x00000007ff600000, 0x00000007ff6141a0, 0x00000007ff8b0000)
[0.371s][info   ][gc,heap,exit   ]   from space 320K,   0% used [0x00000007ff900000, 0x00000007ff900000, 0x00000007ff950000)
[0.371s][info   ][gc,heap,exit   ]   to   space 320K,   0% used [0x00000007ff8b0000, 0x00000007ff8b0000, 0x00000007ff900000)
[0.371s][info   ][gc,heap,exit   ]  concurrent mark-sweep generation total 6848K, used 5069K [0x00000007ff950000, 0x0000000800000000, 0x0000000800000000)
[0.371s][info   ][gc,heap,exit   ]  Metaspace       used 6923K, capacity 7028K, committed 7168K, reserved 1056768K
[0.371s][info   ][gc,heap,exit   ]   class space    used 625K, capacity 659K, committed 768K, reserved 1048576K

Process finished with exit code 0
3.2、AbandonedConnectionCleanupThread源码分析
分析的是**mysql-connector-java 8.0.21版本**
3.2.1、相关属性
// 是对数据库连接的一个幽灵引用(PhantomReference)线程安全的集合
// 用于跟踪数据库连接何时可以被垃圾回收器回收。
private static final Set<ConnectionFinalizerPhantomReference> connectionFinalizerPhantomRefs = ConcurrentHashMap.newKeySet();

// 对象被垃圾回收器标记为可回收时,它的引用会被添加到这个队列中。
private static final ReferenceQueue<MysqlConnection> referenceQueue = new ReferenceQueue<>();


// 线程池
private static final ExecutorService cleanupThreadExcecutorService;

// 清理线程的引用
private static Thread threadRef = null;

// 锁对象
private static Lock threadRefLock = new ReentrantLock();
3.2.2、初始化监听引用队列的线程的静态代码块
通过这个静态初始化块,AbandonedConnectionCleanupThread 类确保了在类被加载时,一个用于清理被遗弃数据库连接的守护线程将被创建并启动。这个设计允许应用程序在运行期间自动管理和清理未正确关闭的数据库连接资源,从而减少资源泄露的风险。
该线程监听引用队列referenceQueue,定时取出referenceQueue的元素,释放连接资源
static {
    // 创建单线程执行器
    cleanupThreadExcecutorService = Executors.newSingleThreadExecutor(r -> {
        Thread t = new Thread(r, "mysql-cj-abandoned-connection-cleanup");
        t.setDaemon(true);
        // Tie the thread's context ClassLoader to the ClassLoader that loaded the class instead of inheriting the context ClassLoader from the current
        // thread, which would happen by default.
        // Application servers may use this information if they attempt to shutdown this thread. By leaving the default context ClassLoader this thread
        // could end up being shut down even when it is shared by other applications and, being it statically initialized, thus, never restarted again.

        // 设置线程的上下文类加载器,这是为了确保线程在执行时能够访问正确的类和资源。
        // 如果当前类类是Bootstrap顶级加载器加载的,classLoader为null
        ClassLoader classLoader = AbandonedConnectionCleanupThread.class.getClassLoader();
        if (classLoader == null) {
            // 则将系统类加载器(ClassLoader.getSystemClassLoader())设置为线程的上下文类加载器。
            // This class was loaded by the Bootstrap ClassLoader, so lets tie the thread's context ClassLoader to the System ClassLoader instead.
            classLoader = ClassLoader.getSystemClassLoader();
        }

        t.setContextClassLoader(classLoader);
        return threadRef = t;
    });
    cleanupThreadExcecutorService.execute(new AbandonedConnectionCleanupThread());
}
为什么要设置线程下上文类加载器
关于JDK1.2-JDK9使用的类加载器以及双亲委派模型参考往期博客:《深入理解Java虚拟机第3版》类文件结构、虚拟机类加载机制
在Java中,类加载器(ClassLoader)是用于加载类的一个对象。每个类都有一个类加载器,负责将类的字节码加载到Java虚拟机(JVM)中。当你创建一个新的线程时,这个线程会继承创建它的线程的上下文类加载器。设置线程的上下文类加载器是为了确保线程能够访问正确的类和资源,特别是在执行任务时需要加载类或资源的场景下。
为什么需要设置线程的上下文类加载器?
在复杂的应用环境中,特别是在运行在容器中的应用(如Web应用运行在Servlet容器中),不同的组件可能由不同的类加载器加载。如果不正确设置线程的上下文类加载器,线程可能无法找到或访问特定的类或资源,因为它默认使用的类加载器可能不是加载这些资源的类加载器。
举个例子,假设我们有一个Web应用,它运行在一个Servlet容器中,如Tomcat。这个Web应用使用了一个第三方库,这个库在后台启动了一个线程来执行某些任务。这个任务需要加载一些只有Web应用类加载器Application ClassLoader才知道的类(例如,Web应用中定义的类)。
public class MyTask implements Runnable {
    @Override
    public void run() {
        // 任务逻辑,可能需要加载特定的类
    }
}

public class MyLibrary {
    public void startTask() {
        Thread taskThread = new Thread(new MyTask(), "MyTaskThread");
        // 设置线程的上下文类加载器为当前类的类加载器
        taskThread.setContextClassLoader(MyLibrary.class.getClassLoader());
        taskThread.start();
    }
}
在这个例子中,MyLibrary 类的 startTask 方法创建并启动了一个新的线程来执行 MyTask。为了确保这个线程能够访问Web应用中定义的类,我们通过调用 setContextClassLoader 方法将线程的上下文类加载器设置为 MyLibrary 类的类加载器。这样,当 MyTask 运行时,它就能够加载和访问那些特定的类了。
如果 MyLibrary 类是由Bootstrap类加载器加载的(这在实际中很少见,因为Bootstrap类加载器主要加载Java核心类库),那么 MyLibrary.class.getClassLoader() 会返回 null。在这种情况下,我们可以将系统类加载器(ClassLoader.getSystemClassLoader())设置为线程的上下文类加载器,以确保线程能够访问系统类路径上的类和资源。
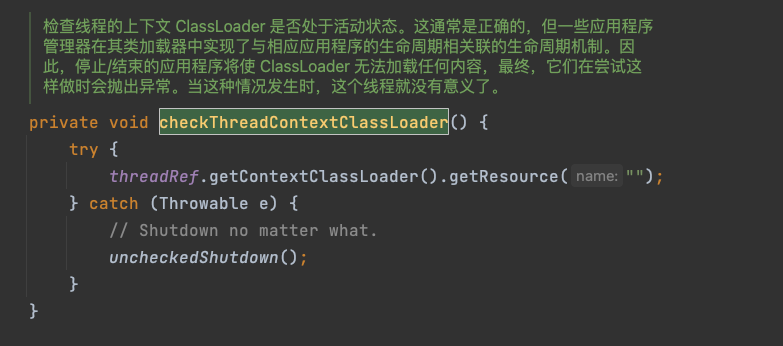
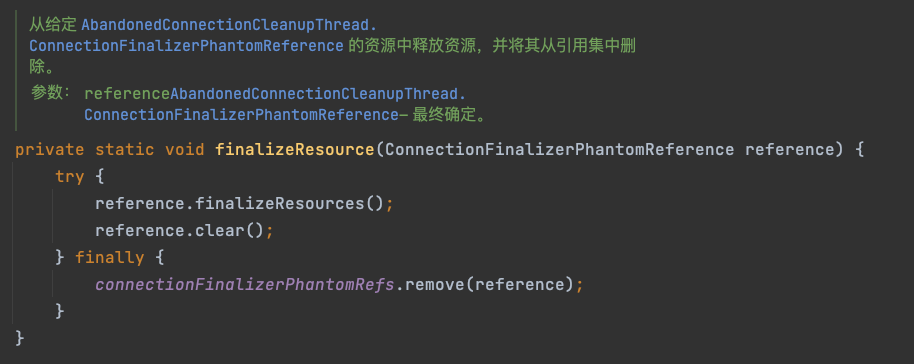
3.2.3、清理数据库连接资源相关方法
public void run() {
    for (;;) {
        try {
            // 检查线程的上下文类加载器是否可哟哦那个
            checkThreadContextClassLoader();
            // 删除队列的下一个元素,超时时间是5000ms,期间需要加锁
            Reference<? extends MysqlConnection> reference = referenceQueue.remove(5000);
            if (reference != null) {
                // 将持有的数据库连接虚引用对象释放,因为虚引用对象已经到了虚引用队列,下一步就会被GC回收
                finalizeResource((ConnectionFinalizerPhantomReference) reference);
            }
        } catch (InterruptedException e) {
            threadRefLock.lock();
            try {
                threadRef = null;

                // Finalize remaining references.
                Reference<? extends MysqlConnection> reference;
                while ((reference = referenceQueue.poll()) != null) {
                    finalizeResource((ConnectionFinalizerPhantomReference) reference);
                }
                connectionFinalizerPhantomRefs.clear();
            } finally {
                threadRefLock.unlock();
            }
            return;
        } catch (Exception ex) {
            // Nowhere to really log this.
        }
    }
}
检查该类的线程上下文加载器
从虚引用队列取出一个虚引用实例,内部逻辑释放虚引用实例标记的数据库连接资源MySQL Connection,然后移除该虚引用实例
具体的关闭MySQL Connection逻辑在NetworkSource类,该类是对Socket mysqlConnection、输入、输出流的封装
    /**
     * Forcibly closes the underlying socket to MySQL.
     */
    public final void forceClose() {

        // 关闭connectioon的输入流
        try {
            if (!ExportControlled.isSSLEstablished(this.mysqlConnection)) { // Fix for Bug#56979 does not apply to secure sockets.
                try {
                    if (this.mysqlInput != null) {
                        this.mysqlInput.close();
                    }
                } finally {
                    if (this.mysqlConnection != null && !this.mysqlConnection.isClosed() && !this.mysqlConnection.isInputShutdown()) {
                        try {
                            this.mysqlConnection.shutdownInput();
                        } catch (UnsupportedOperationException e) {
                            // Ignore, some sockets do not support this method.
                        }
                    }
                }
            }
        } catch (IOException e) {
            // Can't do anything constructive about this.
        }

        // 关闭connectioon的输出流
        try {
            if (!ExportControlled.isSSLEstablished(this.mysqlConnection)) { // Fix for Bug#56979 does not apply to secure sockets.
                try {
                    if (this.mysqlOutput != null) {
                        this.mysqlOutput.close();
                    }
                } finally {
                    if (this.mysqlConnection != null && !this.mysqlConnection.isClosed() && !this.mysqlConnection.isOutputShutdown()) {
                        try {
                            this.mysqlConnection.shutdownOutput();
                        } catch (UnsupportedOperationException e) {
                            // Ignore, some sockets do not support this method.
                        }
                    }
                }
            }
        } catch (IOException e) {
            // Can't do anything constructive about this.
        }

        // 关闭connection连接

        try {
            if (this.mysqlConnection != null) {
                this.mysqlConnection.close();
            }
        } catch (IOException e) {
            // Can't do anything constructive about this.
        }
    }
Socket和MySQLConnection之间的联系
上述关闭数据库连接资源是关闭的Socket和输入输出流,但是MySQL JDBC驱动定义的数据库连接资源是MySQLConnection类
- 在 Java 中,Socket 类是 java.net 包的一部分,用于实现网络通信。数据库连接资源标记方法
- 这通常是指在 MySQL JDBC 驱动中定义的一个类,用于表示与 MySQL 数据库的连接。MySQLConnection 不是 Java 标准库的一部分,而是 MySQL Connector/J(MySQL 的官方 JDBC 驱动)或其他 JDBC 驱动实现中的一个类。这个类封装了与 MySQL 数据库服务器进行通信所需的所有细节,包括发送查询、接收结果等。
二者之间的联系:MySQLConnection 和 Socket 类之间的联系主要体现在 MySQLConnection 使用 Socket 来实现与 MySQL 数据库服务器的网络通信。当你使用 JDBC 驱动连接到 MySQL 数据库时,MySQLConnection 类的实例背后通常会创建一个 Socket 连接,通过这个 Socket 连接发送 SQL 命令给数据库服务器,并接收服务器的响应。具体来说,MySQLConnection 类的实现会处理以下任务:
- 解析数据库连接 URL,提取服务器地址、端口号等信息。
- 使用提取的信息,创建一个 Socket 实例,连接到 MySQL 服务器。
- 管理 Socket 连接的生命周期,包括打开连接、发送数据、接收数据以及最终关闭连接。
- 封装 SQL 命令的发送和结果集的接收,提供给应用程序一个高级的接口来执行数据库操作。
因此,虽然应用程序开发者在使用 JDBC 进行数据库操作时不直接与 Socket 类打交道,但 MySQLConnection 的实现确实依赖于 Socket 来完成与 MySQL 数据库服务器的底层通信。这种设计抽象了网络通信的复杂性,使得开发者可以专注于 SQL 逻辑和数据处理,而不需要处理网络编程的细节。
3.2.4、初始化数据库连接并标记为虚引用
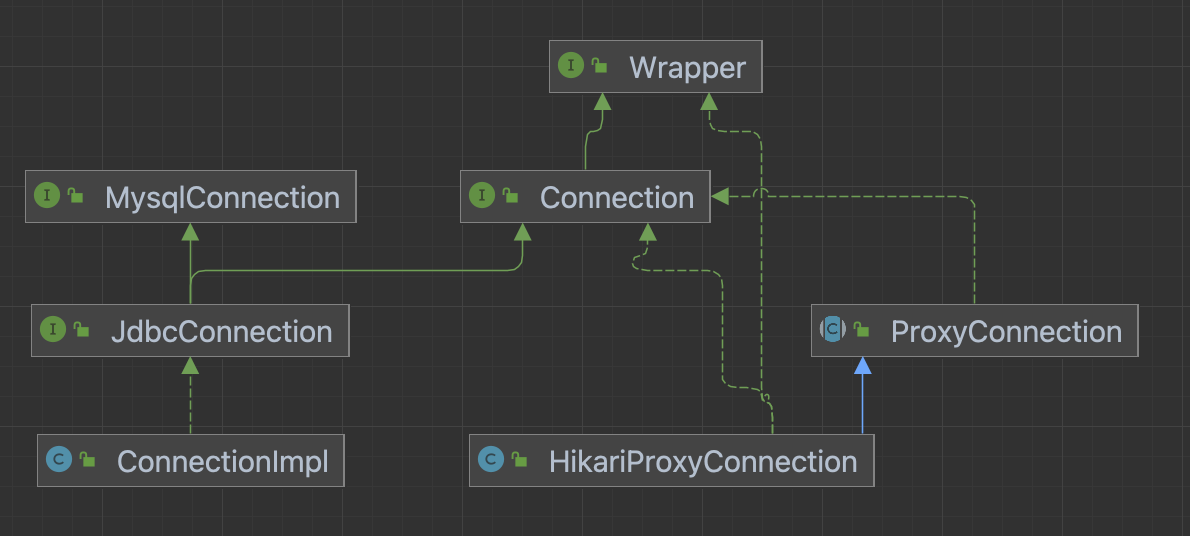
位于java.sql�包下的Conection是为各个MySQL驱动提供的统一接口,MysqlConnection、JdbcConnection则是位于 com.mysql.cj�包下厂商的实现,ProxyConnection、HikarProxyConnection则是com.zaxxer.hikari.pool�包下的类
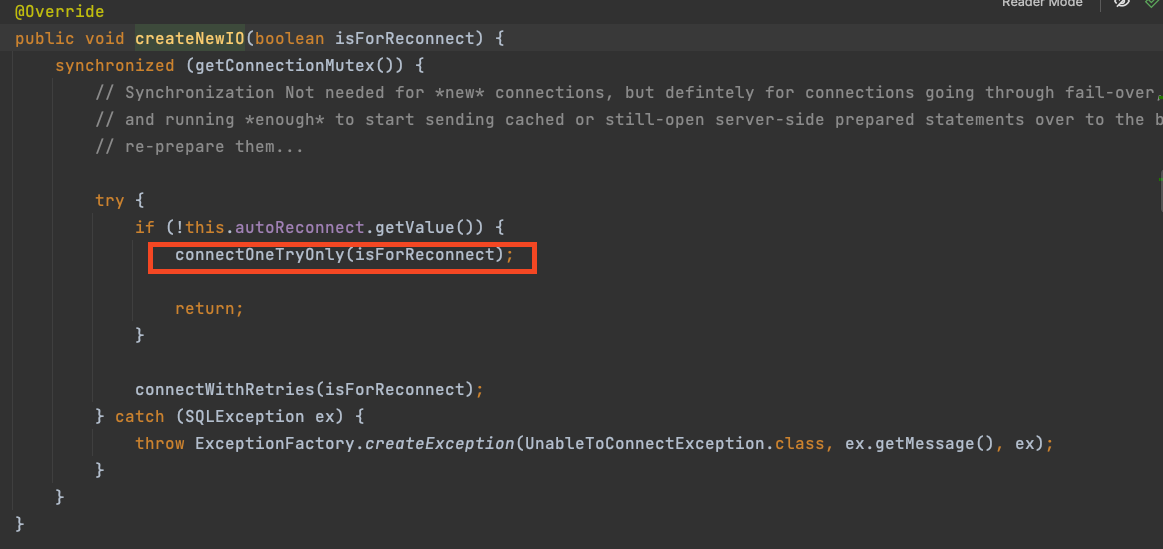
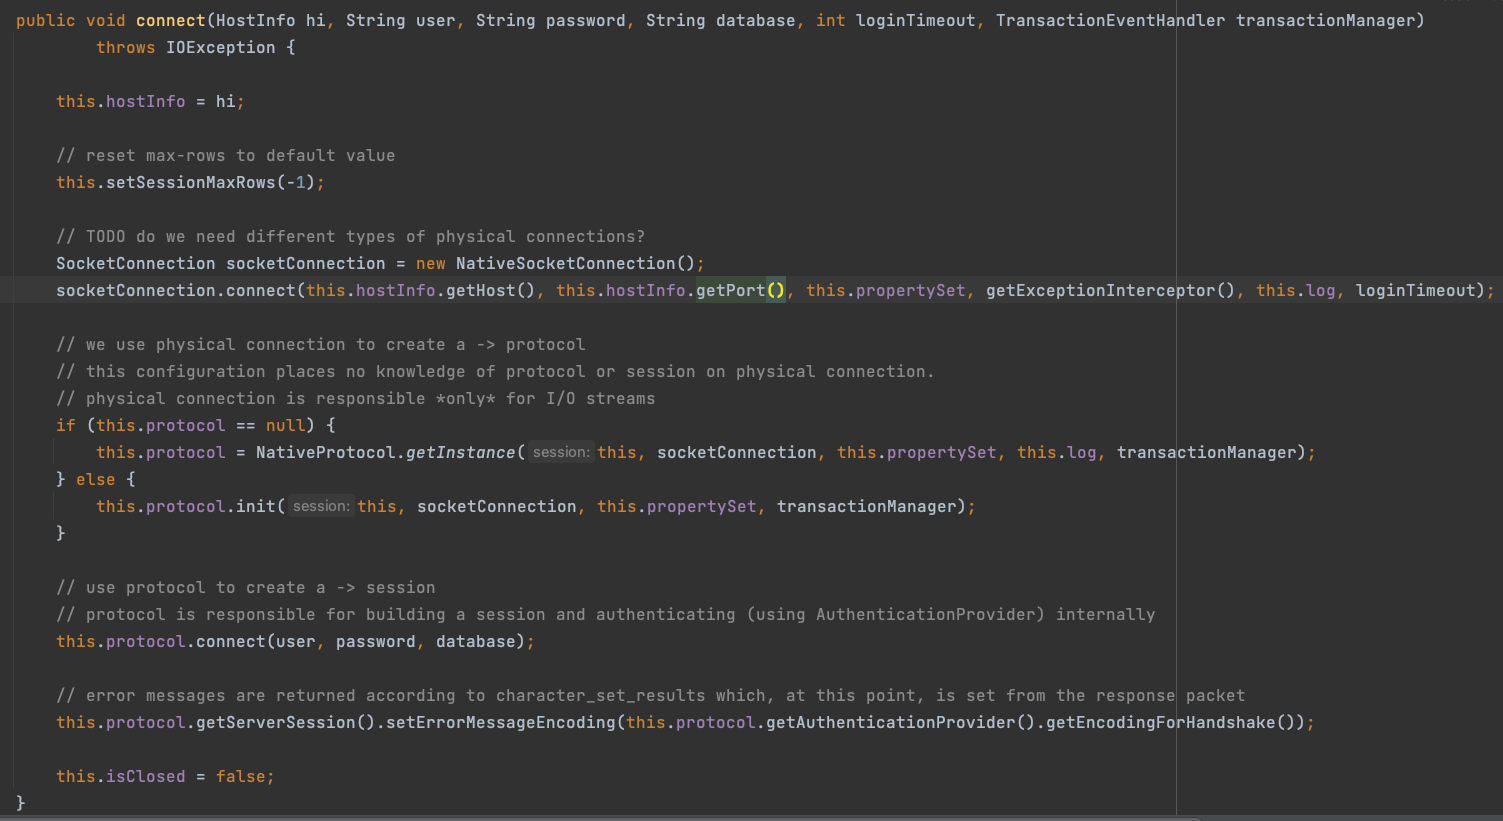
先不看连接池,具体创建数据库连接资源入口在ConnectionImpl实例化会调用的createNewIO方法,然后进入NativeSessioon的connect方法,将数据库连接的一些host、username、password、database、jdbcConnection等创建
这里就是创建了SocketConnection,内部又是一系列协议、封装等
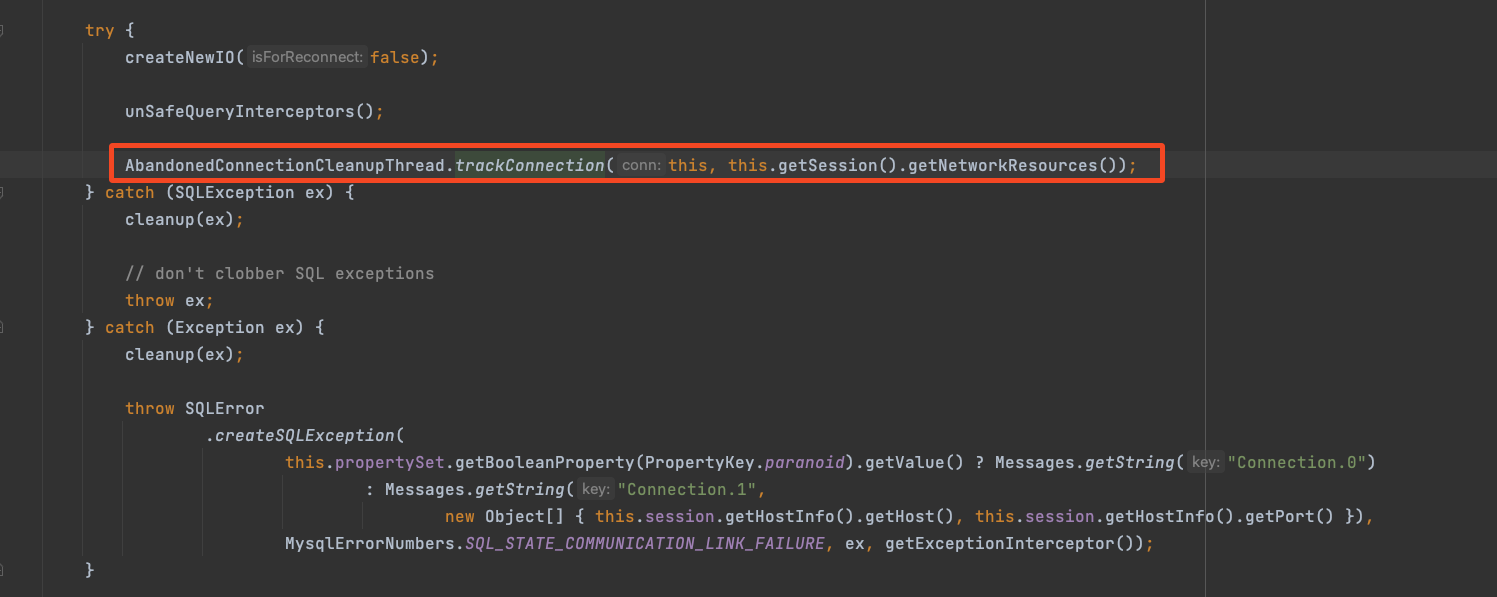
主要关注将连接标记为虚引用的入口,先不看数据库连接池,也就是在ConnectionImpl实例化会调用createNewIO创建SocketConnection之后,调用了一个trackConnection方法,该方法就是将封装在NetworkSource数据库连接标记为虚引用。
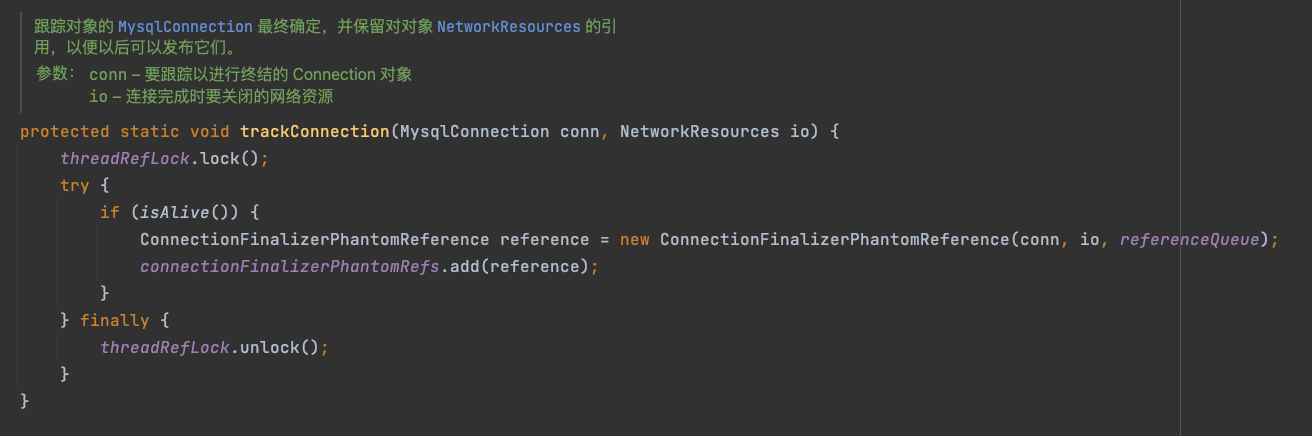
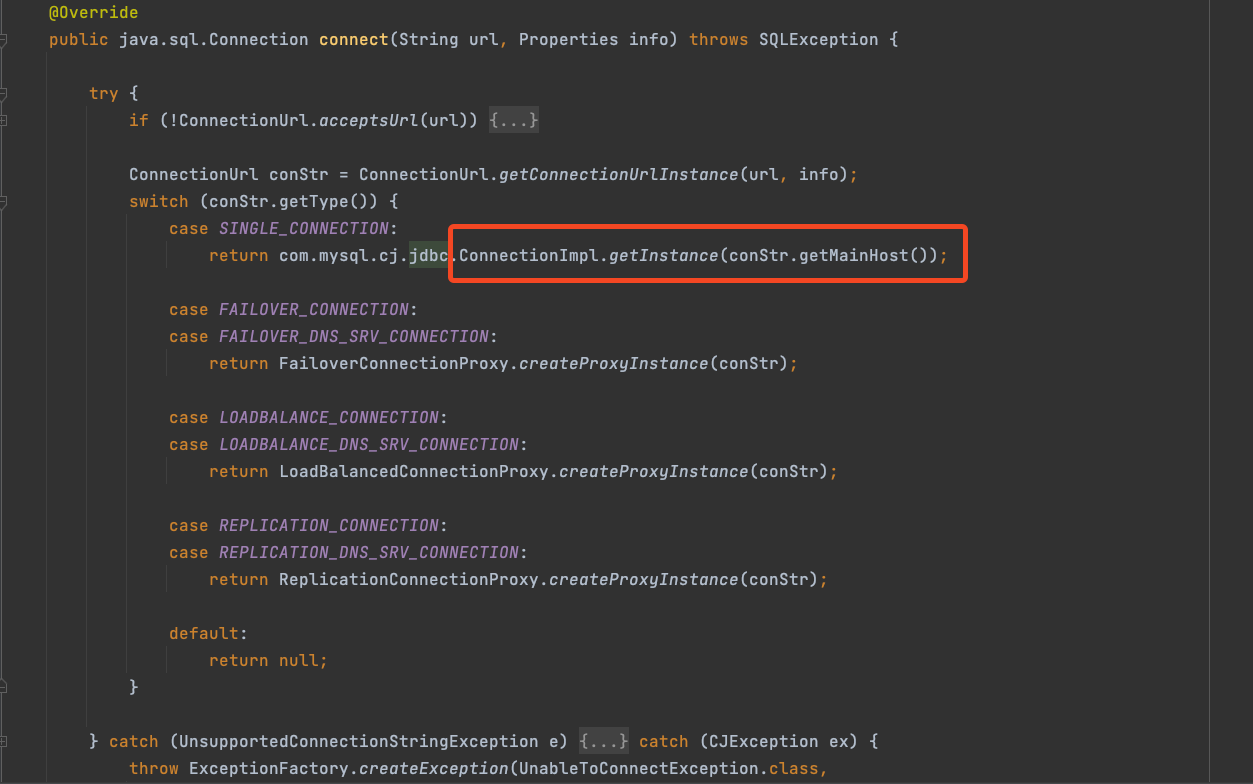
那什么时候会实例化ConnectionImpl呢,在程序启动的时候,如果引入MySQL Driver的话,类加载器会自动加载驱动获取connection连接,对于MySQL Driver该逻辑主要由类NonRegisteringDriver�实现,该类位于包com.mysql.cj.jdbc�,实现了位于java.sql包的Driver,就是这块根据url创建了对应的ConnectionImpl实例,进而初始化数据库连接Socket,并经数据库连接标记为虚引用,便于漏关资源。
3.2.5、HikariPool数据库连接池
项目使用的hikari�连接池,相关连接池的配置在com.zaxxer.hikari�包下的HikariConfig,通过源码可以看出,如果不设置connectionTimeout,默认的是 CONNECTION_TIMEOUT = SECONDS.toMillis(30);
public HikariConfig()
   {
      dataSourceProperties = new Properties();
      healthCheckProperties = new Properties();

      minIdle = -1;
      maxPoolSize = -1;
      maxLifetime = MAX_LIFETIME;
      connectionTimeout = CONNECTION_TIMEOUT;
      validationTimeout = VALIDATION_TIMEOUT;
      idleTimeout = IDLE_TIMEOUT;
      initializationFailTimeout = 1;
      isAutoCommit = true;

      String systemProp = System.getProperty("hikaricp.configurationFile");
      if (systemProp != null) {
         loadProperties(systemProp);
      }
   }
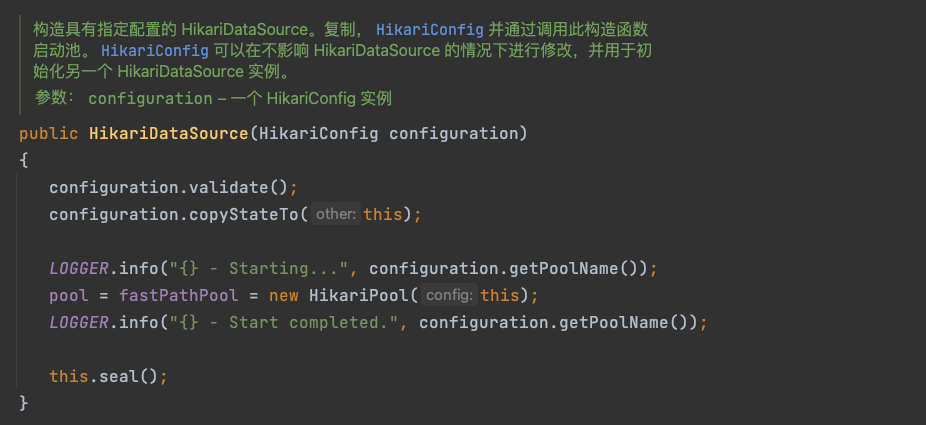
加载配置实例化HikariPool�的逻辑在HikariDataSource类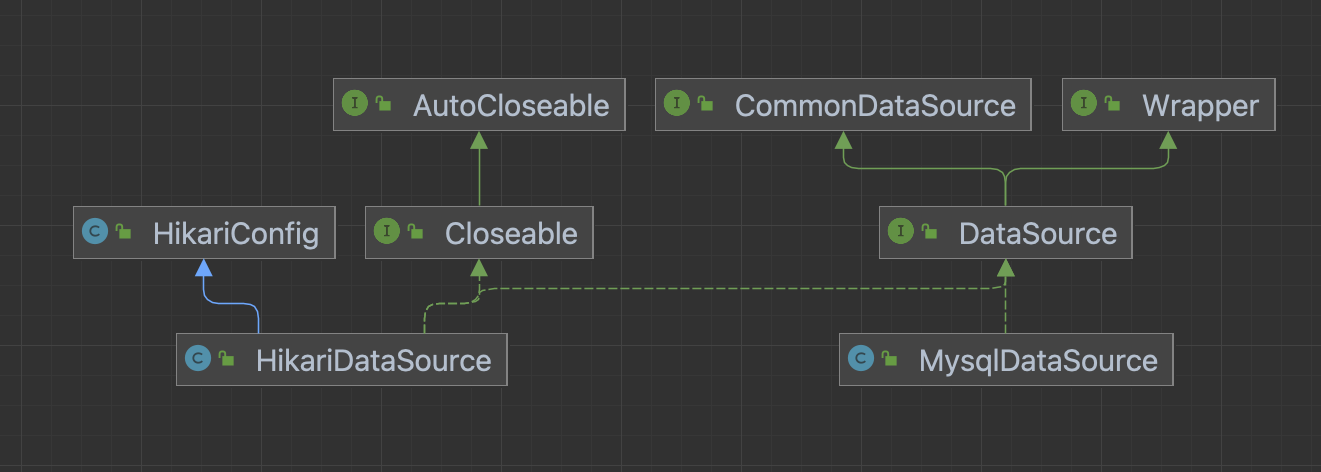
根据相关配置创建pool
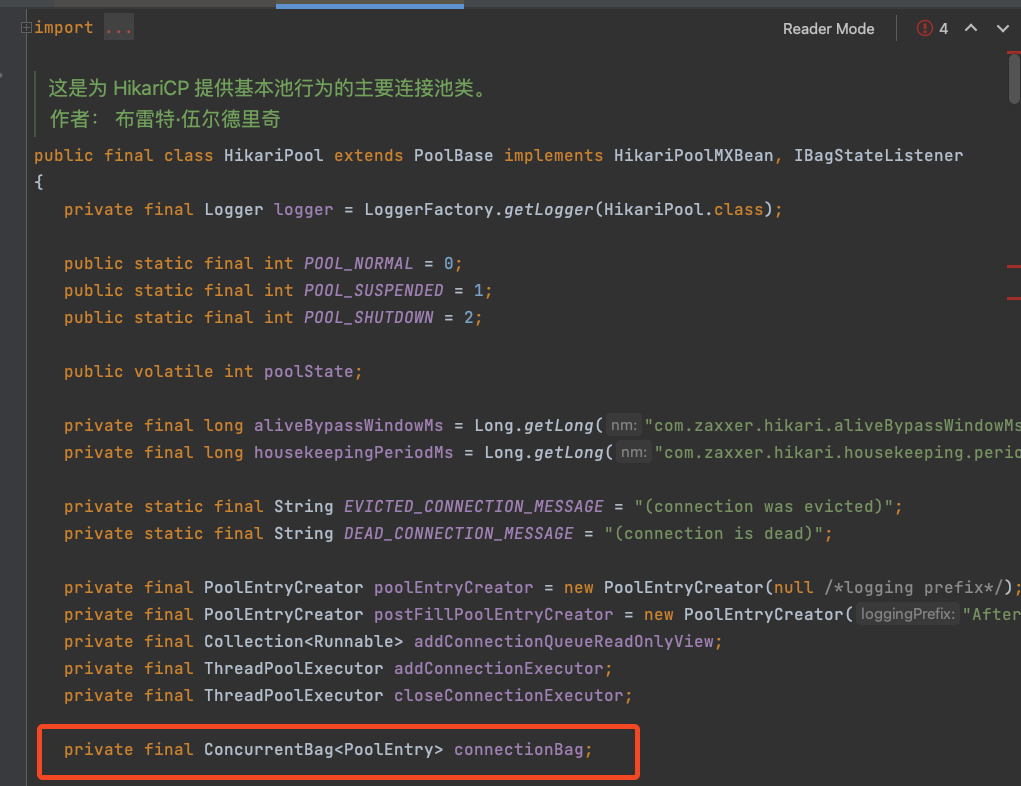
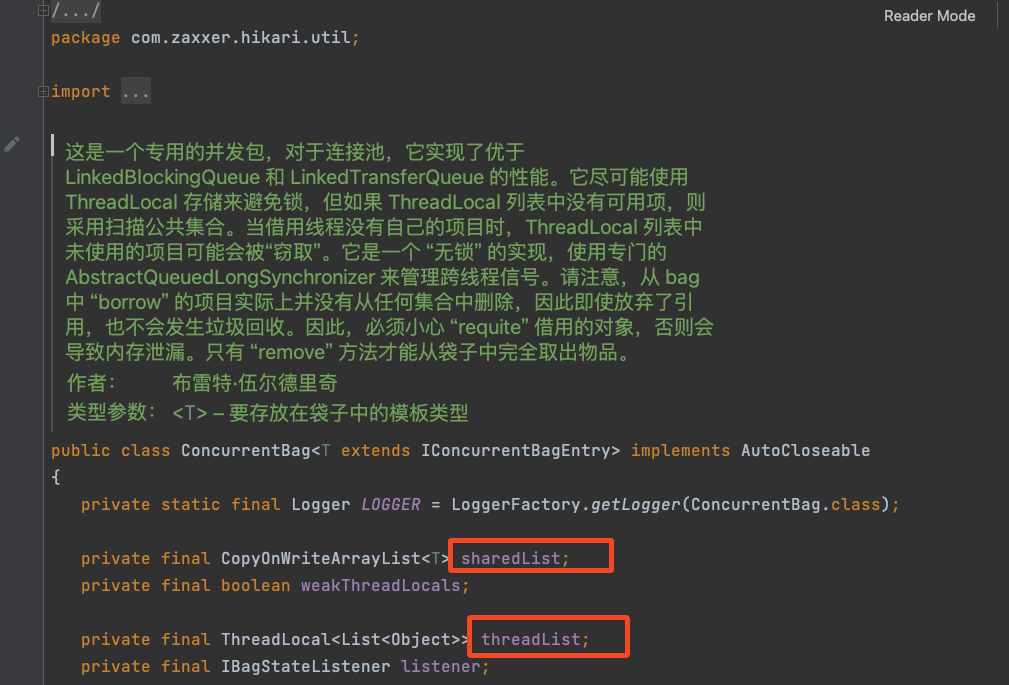
HikariCP的实际池子对象是HikariPool,里面有个ConcurrentBag,用于跟踪 Connection 实例,连接都存在这里(顺便说一下,我们使用的是3.3.5版本)。在这个ConcurrentBag里,连接分为了两部分,一部分放在了ThreadLocal里面,另一部分放在了一个sharedList里面,代码如下:
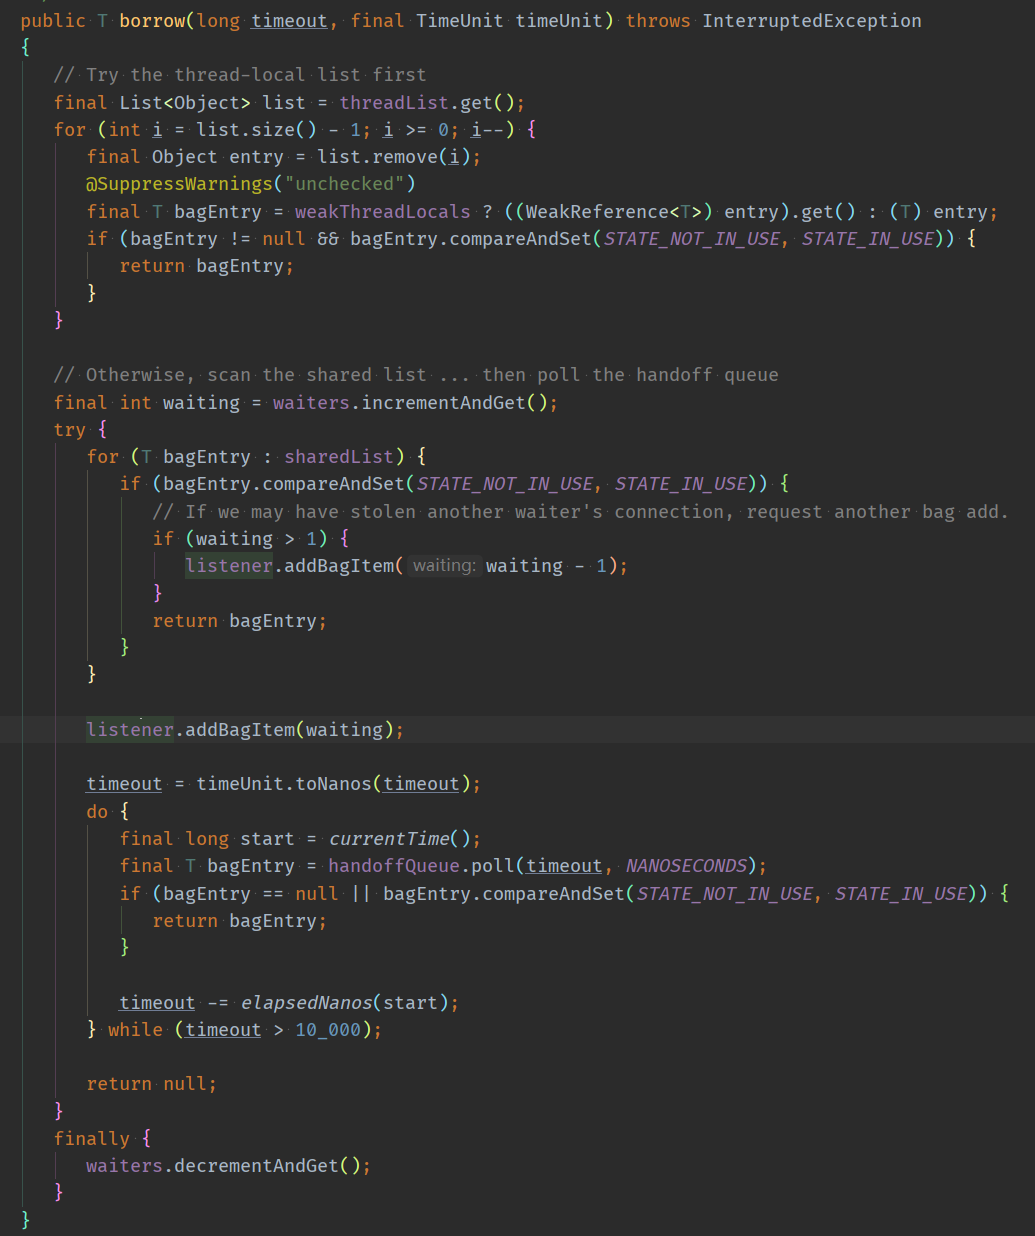
具体的获取连接的代码
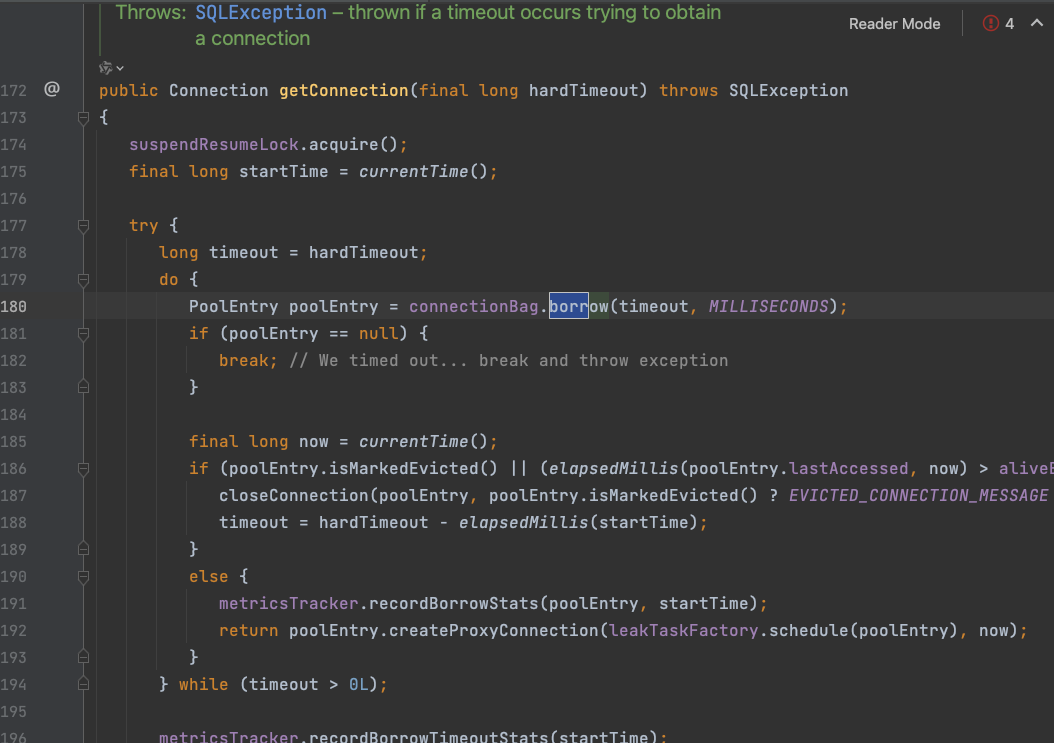
当我们向HikariPool要连接的时候,Hikari首先到对应的ThreadLocal里去找,发现没找到,再从sharedList里面去取,要是还没有,则会在一个do…while循环中尝试从一个同步Queue中去获取(HikariCP在后台创建的一个线程来创建连接并填充这个Queue,具体在这里不展开了)。
参数
HikariCP 连接池配置参数的解释:
- connection-timeout: 5000
- 描述: 这是客户端(应用程序)等待从连接池获取连接的最长时间,以毫秒为单位。在这个例子中,值为 5000 毫秒(即 5 秒)。
- 功能: 如果在这个时间段内没有可用的连接,那么获取连接的请求将会抛出一个超时异常。
- idle-timeout: 1800000
- 描述: 这是连接在连接池中空闲等待的最长时间,以毫秒为单位。在这个例子中,值为 1800000 毫秒(即 30 分钟)。
- 功能: 该属性控制允许连接处于空闲状态的最长时间。。此设置仅在
**<font style="color:rgb(31, 35, 40);">minimumIdle</font>**定义为小于**<font style="color:rgb(31, 35, 40);">maximumPoolSize</font>**时适用。一旦池达到<font style="color:rgb(31, 35, 40);">minimumIdle</font>连接数,空闲连接就不会被终止。无论是 连接因空闲而退出的最大变化为 +30 秒,平均 +15秒的变化。在此超时之前,连接永远不会因空闲而退出。一个值 0 表示空闲连接永远不会从池中删除。最小允许值为 10000ms (10 秒)。 默认值:600000(10 分钟)
- max-lifetime: 3600000
- 描述: 这是连接池中连接的最长生命周期,以毫秒为单位。在此例中,值为 3600000 毫秒(即 1 小时)。
- 功能: 该属性控制池中连接的最长生命周期。正在使用的连接将 永远不会退休,只有当它关闭时才会被删除。在逐个连接上 在此基础上,应用较小的负衰减以避免池中的大规模灭绝。我们强烈建议设置此值,它应该比任何数据库或基础设施施加的连接时间限制短几秒。值为 0 表示没有最大生命周期(无限生命周期),主题为 当然是
<font style="color:rgb(31, 35, 40);">idleTimeout</font>设置。允许的最小值为 30000 毫秒(30 秒)。 默认值:1800000(30 分钟)
- maximum-pool-size: 20
- 描述: 这是连接池中可存储的最大连接数。
- 功能: 指定连接池最多可同时打开的连接数量。对于多数应用程序,默认值通常够用。但若应用程序较大或者请求数较多,可能需要增加该值。
- minimum-idle: 5
- 描述: 这是连接在连接池中维持的最少空闲连接数。
- 功能: 连接池将保持至少这个数量的连接处于空闲状态,而不会将其关闭。它的优先级通常低于
<font style="color:rgb(51, 51, 51);">maximum-pool-size</font>。
4、原因分析
为什么HikariPool连接池频繁创建那么多连接?全部堆积到了老年代?理论上来说,连接池是不会频繁的创建连接的,除非有活跃连接很少,且存在波动,即使这种连接对象因该被正常 or 超时关闭,不会导致堆内存一直上升。
查看数据库配置
show global variables like ‘%timeout%’ ;查看数据库wait_time=900s,也就是15分钟
show variables like ‘%max_connection%’; 查看数据库最大连接数
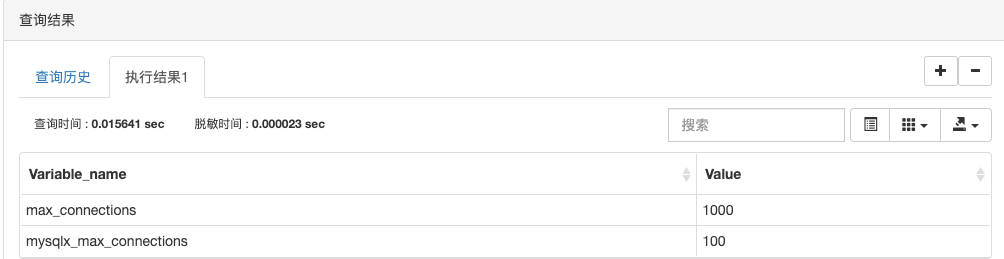
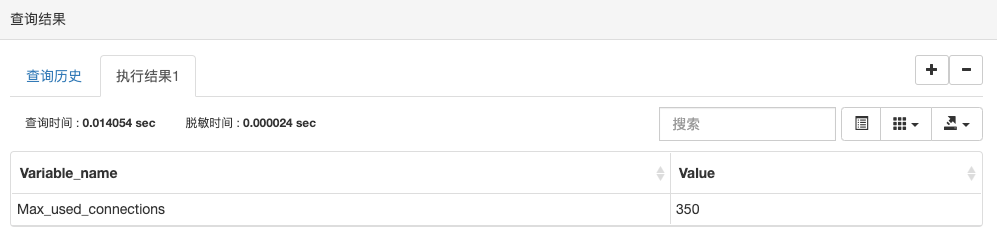
show status like ‘max_used_connections’; 查看数据库当前连接数
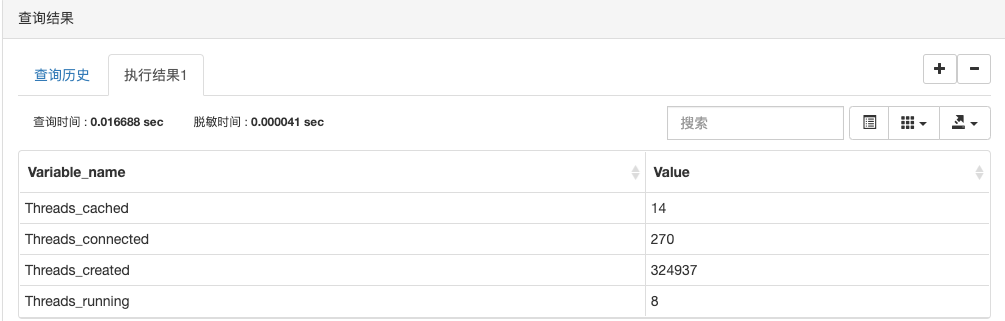
show status like ‘Threads%’; 查看数据库线程信息
show processlist; 查看连接明细
然后需要查看查程序中HikariPool连接池的配置,对于HikariPool有idleTimeout、max-lifetime,目前已经配置,另外还有一个validationTimeout:这个配置项设置了连接在被视为有效之前的最大验证时间(以毫秒为单位)。在从连接池中获取连接时,HikariCP 会检查连接的有效性。如果连接在这个时间内不能被验证为有效,那么它将被关闭并从连接池中移除。默认是5s。
pool-name: xopqbmSpringHikariCP
connection-timeout: 5000 // 获取连接时的最大等待时间(毫秒)。如果超过这个时间还没有获取到连接,则会抛出一个异常。默认值是 30 秒。
idle-timeout: 180000 // 连接在被视为闲置并且可以被关闭之前,可以保持空闲状态的最长时间(毫秒)。默认值是 10 分钟。
max-lifetime: 180000 // 连接的最大生命周期(毫秒)。此值必须小于数据库服务器配置的连接超时时间。默认值是 30 分钟。
maximum-pool-size: 20 // 连接池中允许的最大连接数。这个值会影响应用程序能够处理的并发数据库访问量。默认值是 10。
minimum-idle: 5 // 连接池中维护的最小空闲连接数。HikariCP 会尽力确保连接池中至少有这么多空闲的连接,即使这些连接当前并不需要。默认值与 maximum-pool-size 相同。
回到HikariDataSource创建HikariPool创建的时候,之前有个方法configuration.validate()�是检验pool的配置,内部调用 validateNumerics()方法,会对配置的参数检验
 private void validateNumerics()
   {
      if (maxLifetime != 0 && maxLifetime < SECONDS.toMillis(30)) {
         LOGGER.warn("{} - maxLifetime is less than 30000ms, setting to default {}ms.", poolName, MAX_LIFETIME);
         maxLifetime = MAX_LIFETIME;
      }

      if (leakDetectionThreshold > 0 && !unitTest) {
         if (leakDetectionThreshold < SECONDS.toMillis(2) || (leakDetectionThreshold > maxLifetime && maxLifetime > 0)) {
            LOGGER.warn("{} - leakDetectionThreshold is less than 2000ms or more than maxLifetime, disabling it.", poolName);
            leakDetectionThreshold = 0;
         }
      }

      if (connectionTimeout < 250) {
         LOGGER.warn("{} - connectionTimeout is less than 250ms, setting to {}ms.", poolName, CONNECTION_TIMEOUT);
         connectionTimeout = CONNECTION_TIMEOUT;
      }

      if (validationTimeout < 250) {
         LOGGER.warn("{} - validationTimeout is less than 250ms, setting to {}ms.", poolName, VALIDATION_TIMEOUT);
         validationTimeout = VALIDATION_TIMEOUT;
      }

      if (maxPoolSize < 1) {
         maxPoolSize = DEFAULT_POOL_SIZE;
      }

      if (minIdle < 0 || minIdle > maxPoolSize) {
         minIdle = maxPoolSize;
      }

     // !!!这里会判断 ,符合条件的话 idleTimeout 会被设置为0
     // ps:该值的缺省值为 MINUTES.toMillis(10),也就是10分钟=600000毫秒。
      if (idleTimeout + SECONDS.toMillis(1) > maxLifetime && maxLifetime > 0 && minIdle < maxPoolSize) {
         LOGGER.warn("{} - idleTimeout is close to or more than maxLifetime, disabling it.", poolName);
         idleTimeout = 0;
      }
      else if (idleTimeout != 0 && idleTimeout < SECONDS.toMillis(10) && minIdle < maxPoolSize) {
         LOGGER.warn("{} - idleTimeout is less than 10000ms, setting to default {}ms.", poolName, IDLE_TIMEOUT);
         idleTimeout = IDLE_TIMEOUT;
      }
      else  if (idleTimeout != IDLE_TIMEOUT && idleTimeout != 0 && minIdle == maxPoolSize) {
         LOGGER.warn("{} - idleTimeout has been set but has no effect because the pool is operating as a fixed size pool.", poolName);
      }
   }
根据上面配置,idle-timeout被设置成了0 … 此属性控制允许连接在池中处于空闲状态连接的最长时间(以毫秒为单位)。连接是否因空闲而停用取决于 +30 秒的最大变化和 +15 秒的平均变化。在此超时之前,连接永远不会作为空闲状态停用。值为 0 表示永远不会从池中删除空闲连接,推荐设置的范围为 [0,数据库wait_time]
因此情况就是数据库设置的连接超时wait_time为900s,但是HikariPool中设置的连接超时为180000ms=180s为什么还会有这种情况呢?
连接活跃的时候,会导致HikariPool频繁创建连接(另外是如果设置了maxLifetime,则HikariCP给池中创建的每个连接,都会定时检测,不管这个连接上一次是什么时候使用的,只要在检测时它没在使用中,就会被淘汰。 参考:https://github.com/nethibernate/blog/issues/17)超时又销毁(但是由于某种原因,连接前期正常使用,经过了多次minor GC都没有被回收,晋升到了老年代。但是一段时间过后,由于某种原因连接失效,导致连接池又新建了连接。连接虽然关闭了,每个连接对象资源会被标记一个虚引用引用着,但是没有发生老年代GC,这些连接资源都在Set里面存储,进入不了Queue中,从而没有机会让AbandonedConnectionCleanupThread去清除这些连接。
导致在两次FullGC的区间时间,****ConnectionFinalizerPhantomReference对象堆积的越来越多,占用内存增大,导致最终FullGC压力增大。
ps:这里说的不是很准确,虚引用在任何时候都可以被回收,具体需要JVM决定,前面虚引用demo理解3中证明,即使不发生FullGC,只发生YoungGC,也会回收虚引用对象。
建议将这个值设置的大一些,尽量避免频繁的创建连接。
另外就是建议idle-timeout设置的要比maxLifetime小1秒,否则会被设置为默认的0.
5、本地问题复现
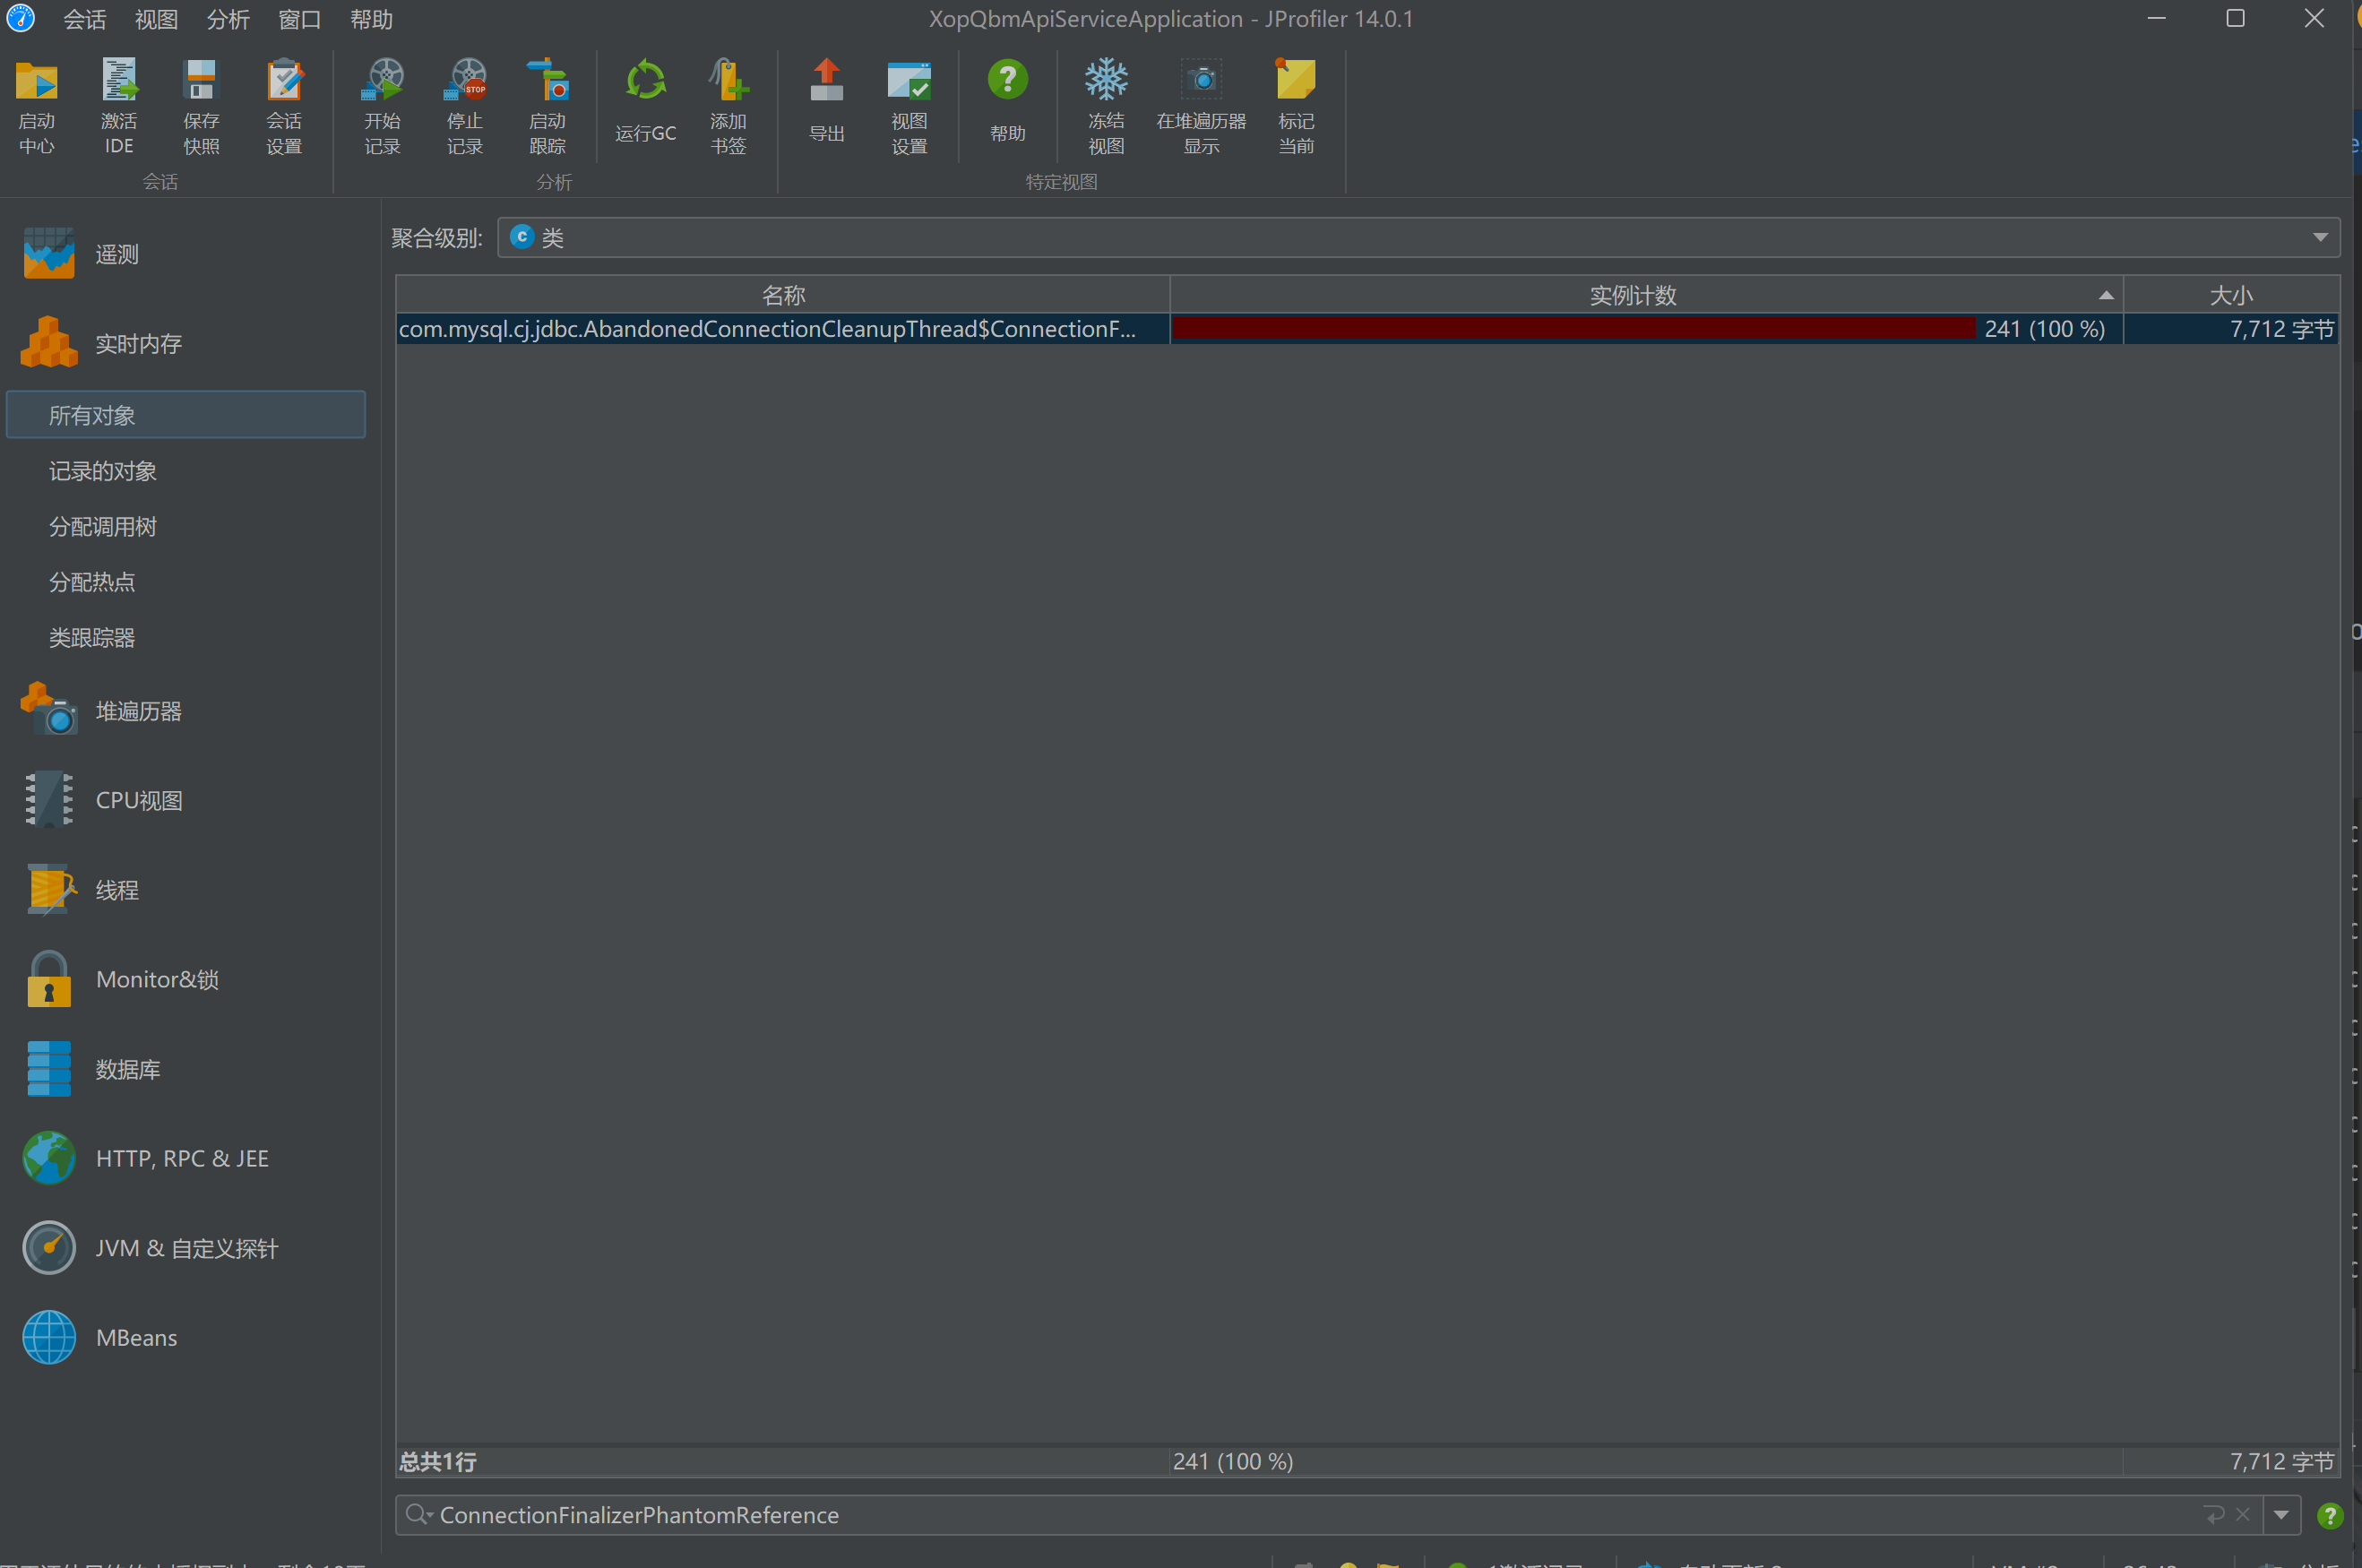
本地通过JMeter压测涉及DB查询的接口,使用JProfile跟踪YoungGC、FullGC的情况以及ConnectionFinalizerPhantomReference对象。
Java版本为8,设置jvm参数为,指定新生代收集器为ParNew,老年代收集器为CMS,这里需要注意尽量将堆设置的大一些,防止发生FullGC。
-XX:+UseParNewGC
-XX:+UseConcMarkSweepGC
-XX:+CMSParallelRemarkEnabled
-XX:CMSInitiatingOccupancyFraction=80
-XX:+UseCMSInitiatingOccupancyOnly
-XX:+HeapDumpOnOutOfMemoryError
1、问题复现压测
hikariPool配置,这里设置xopqbm数据源的idle-timeout为10s,max-lifetime为100s,连接池20个,压测情况下则100s会产生20个ConnectionFinalizerPhantomReference对象,前提是不发生FullGC只发生YoungGC。
connection-timeout: 5000
idle-timeout: 10000 // 10s
max-lifetime: 100000 // 100s
maximum-pool-size: 20
minimum-idle: 5
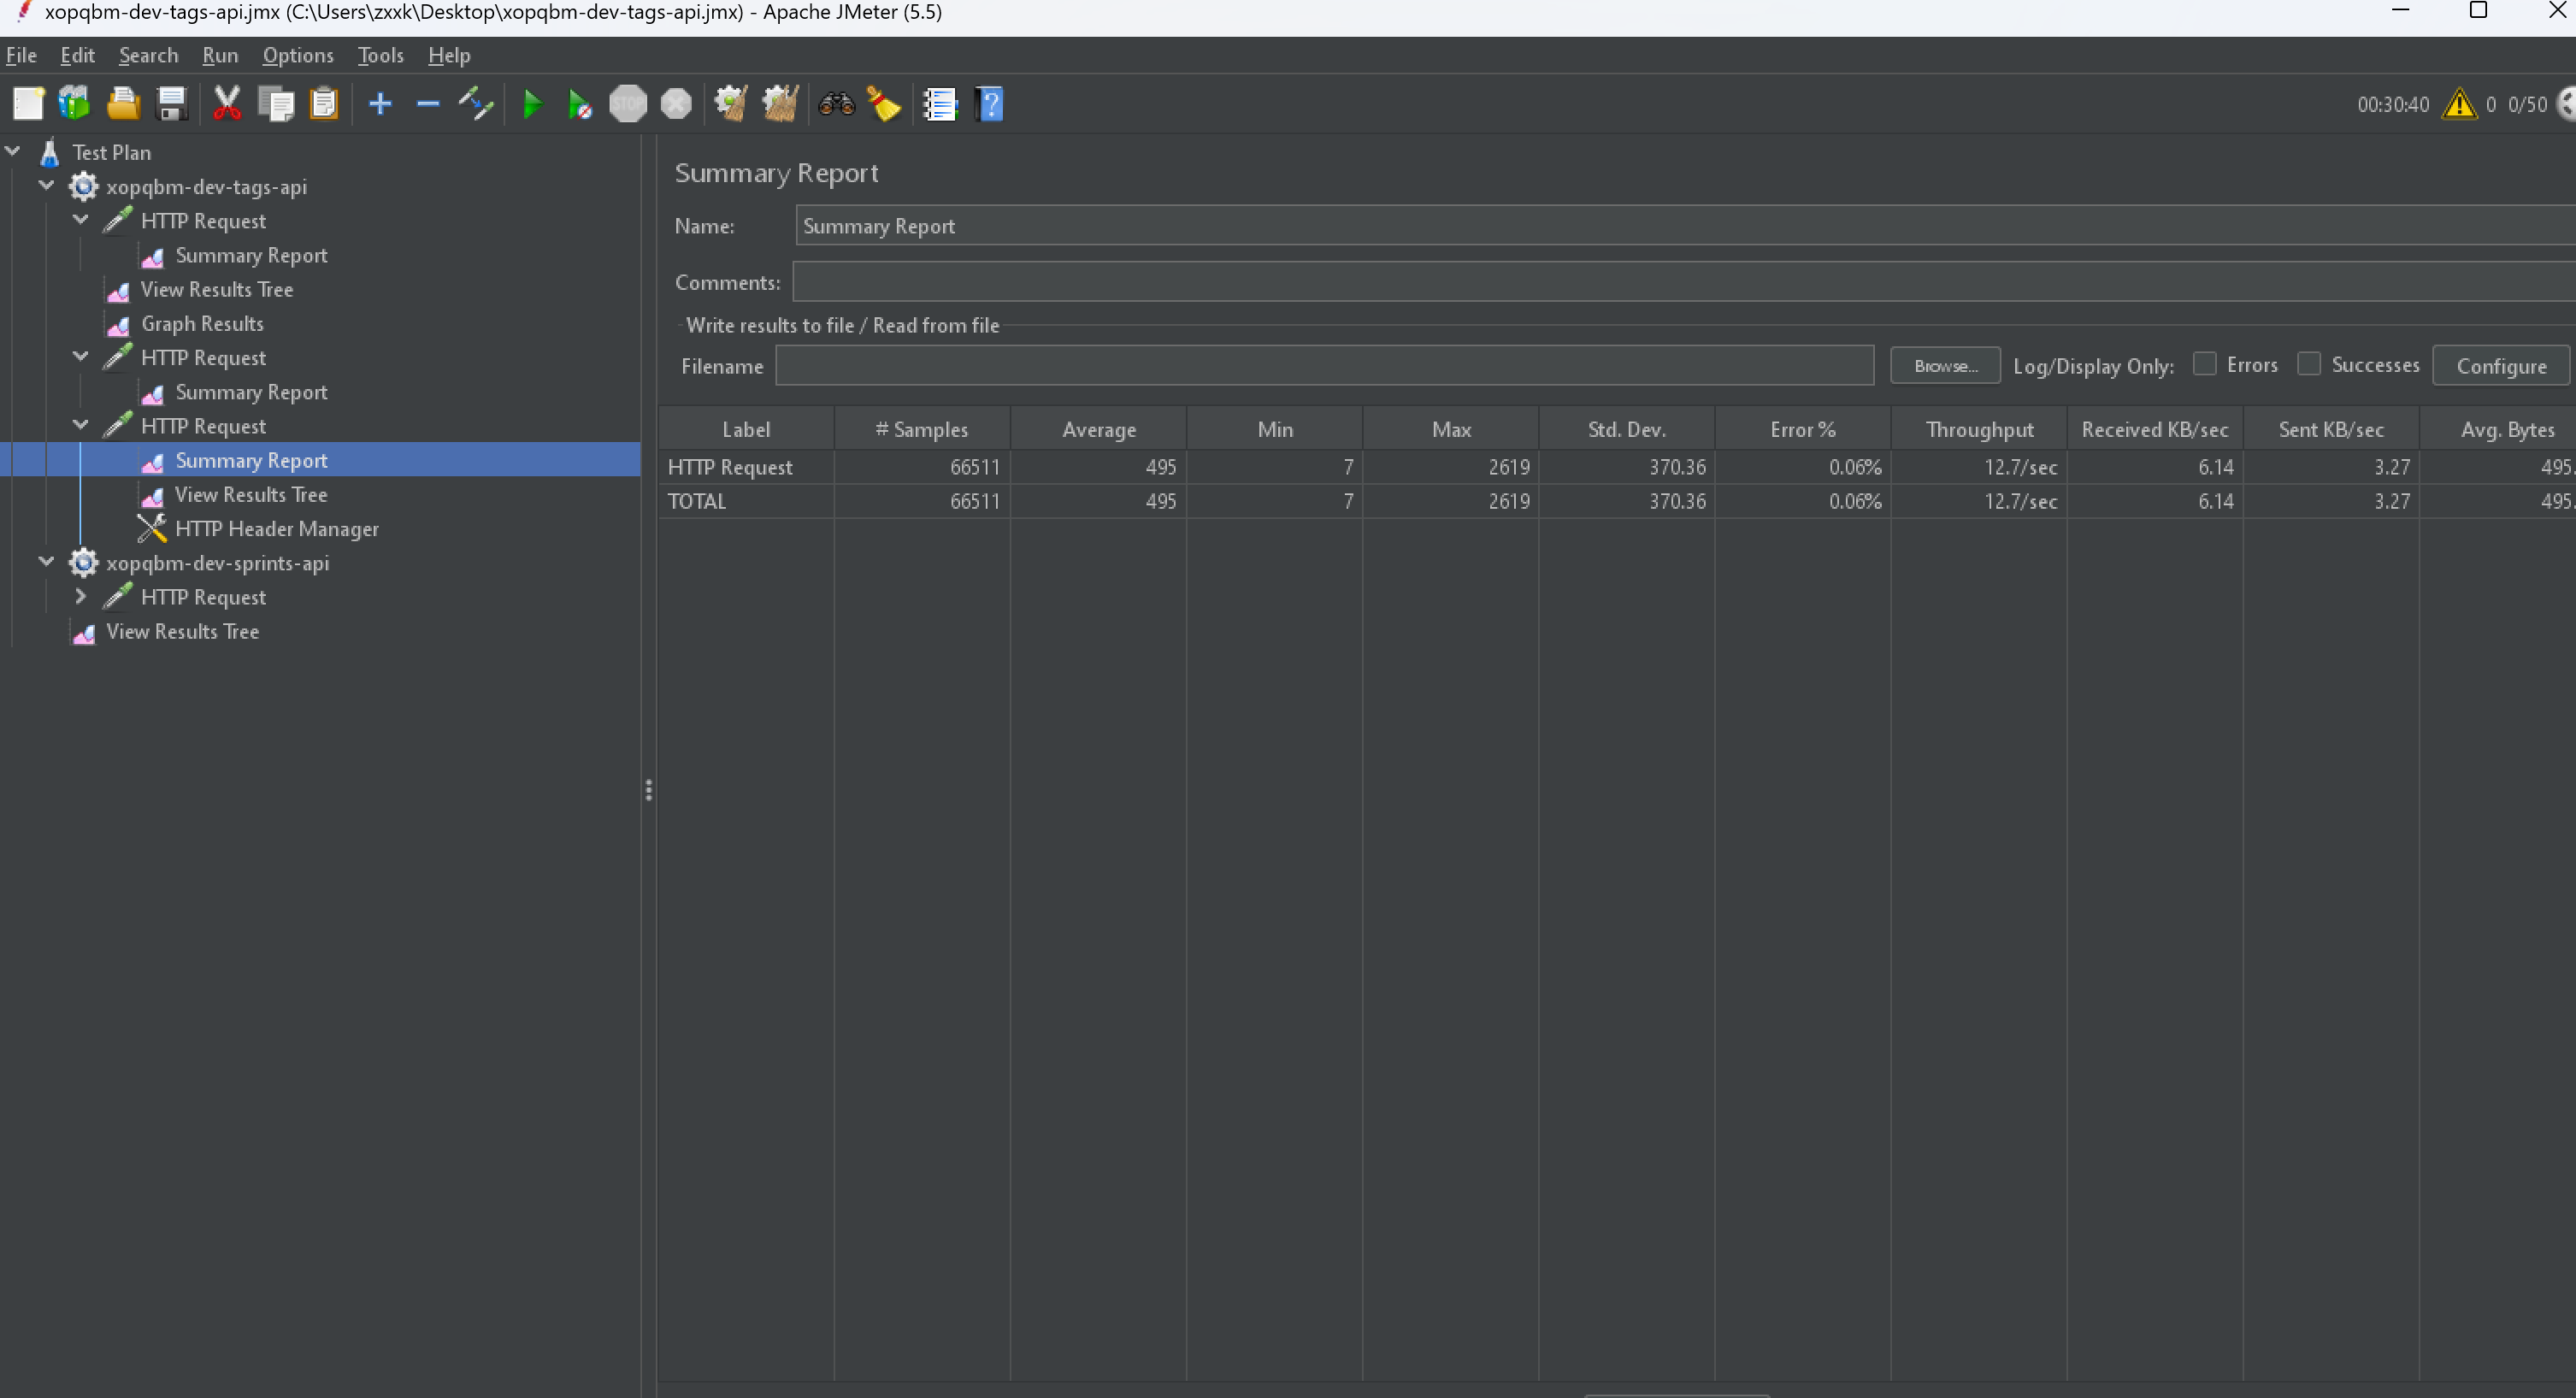
压测三个接口,每个接口对应一个DB源,压测时间近14min,样本近10w
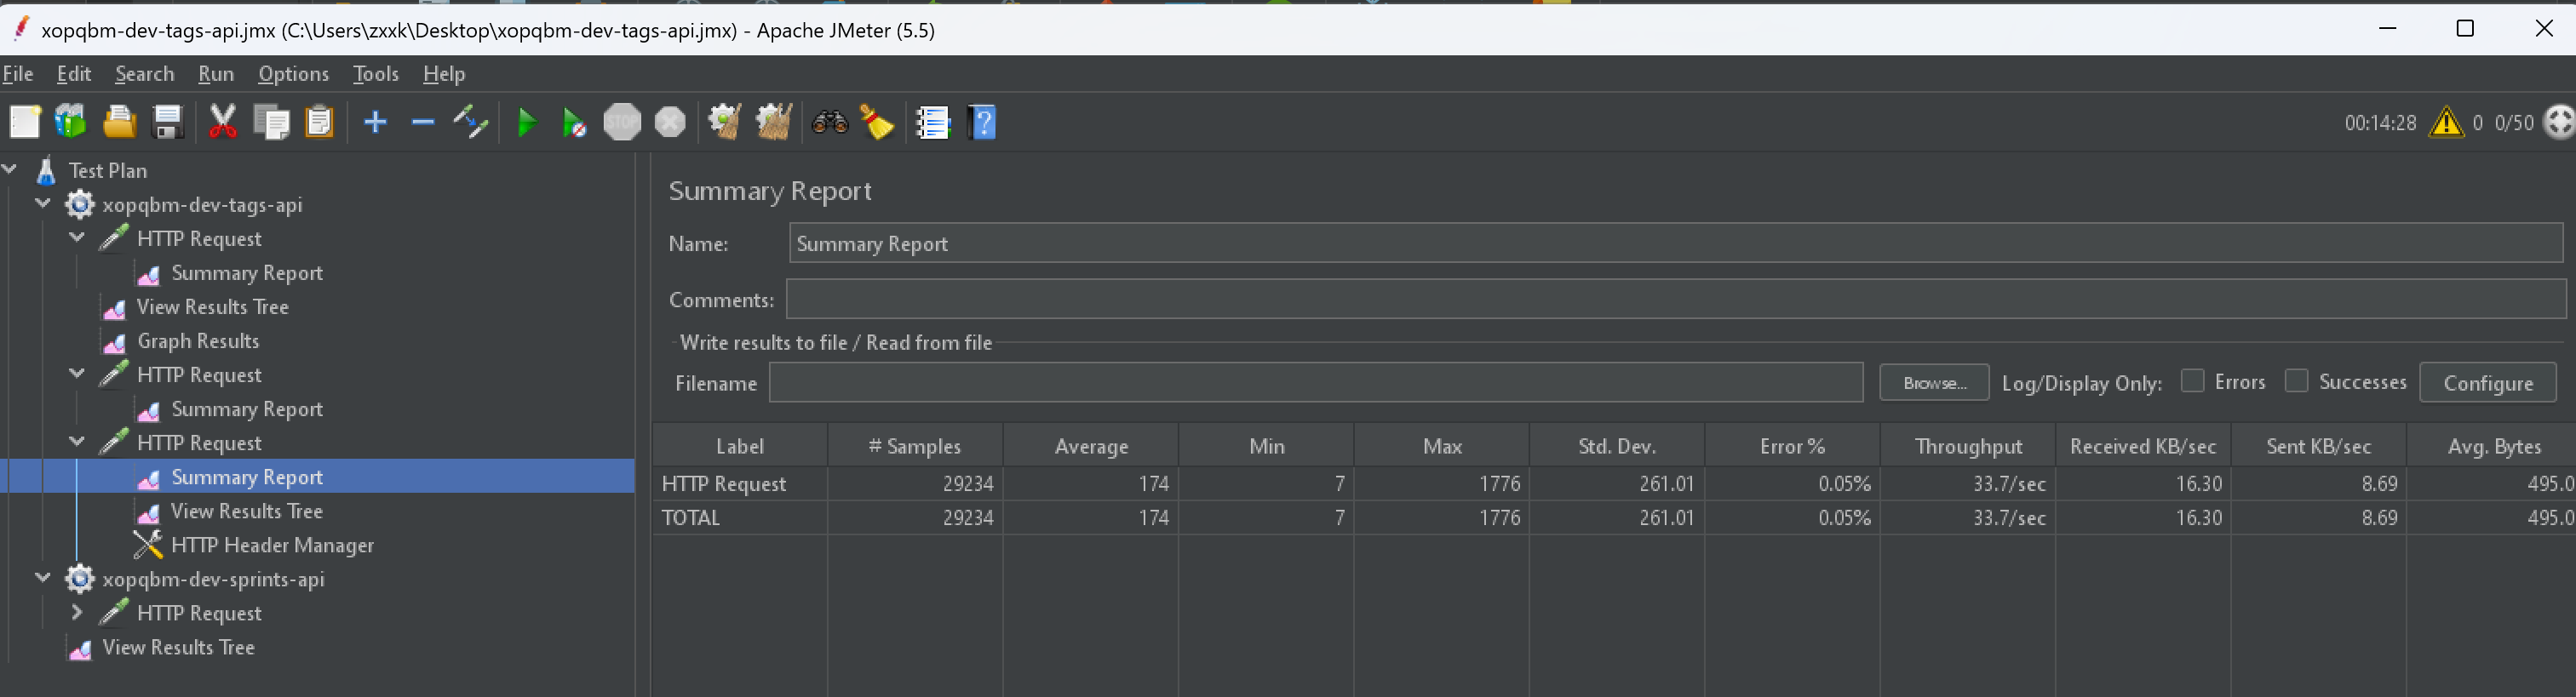
查看JProfile观察ConnectionFinalizerPhantomReference,理论应该生成14 * 60 / 100 * 20 = 160个,通过观察,实际生成了240个,这是因为还有另外两个DB源。
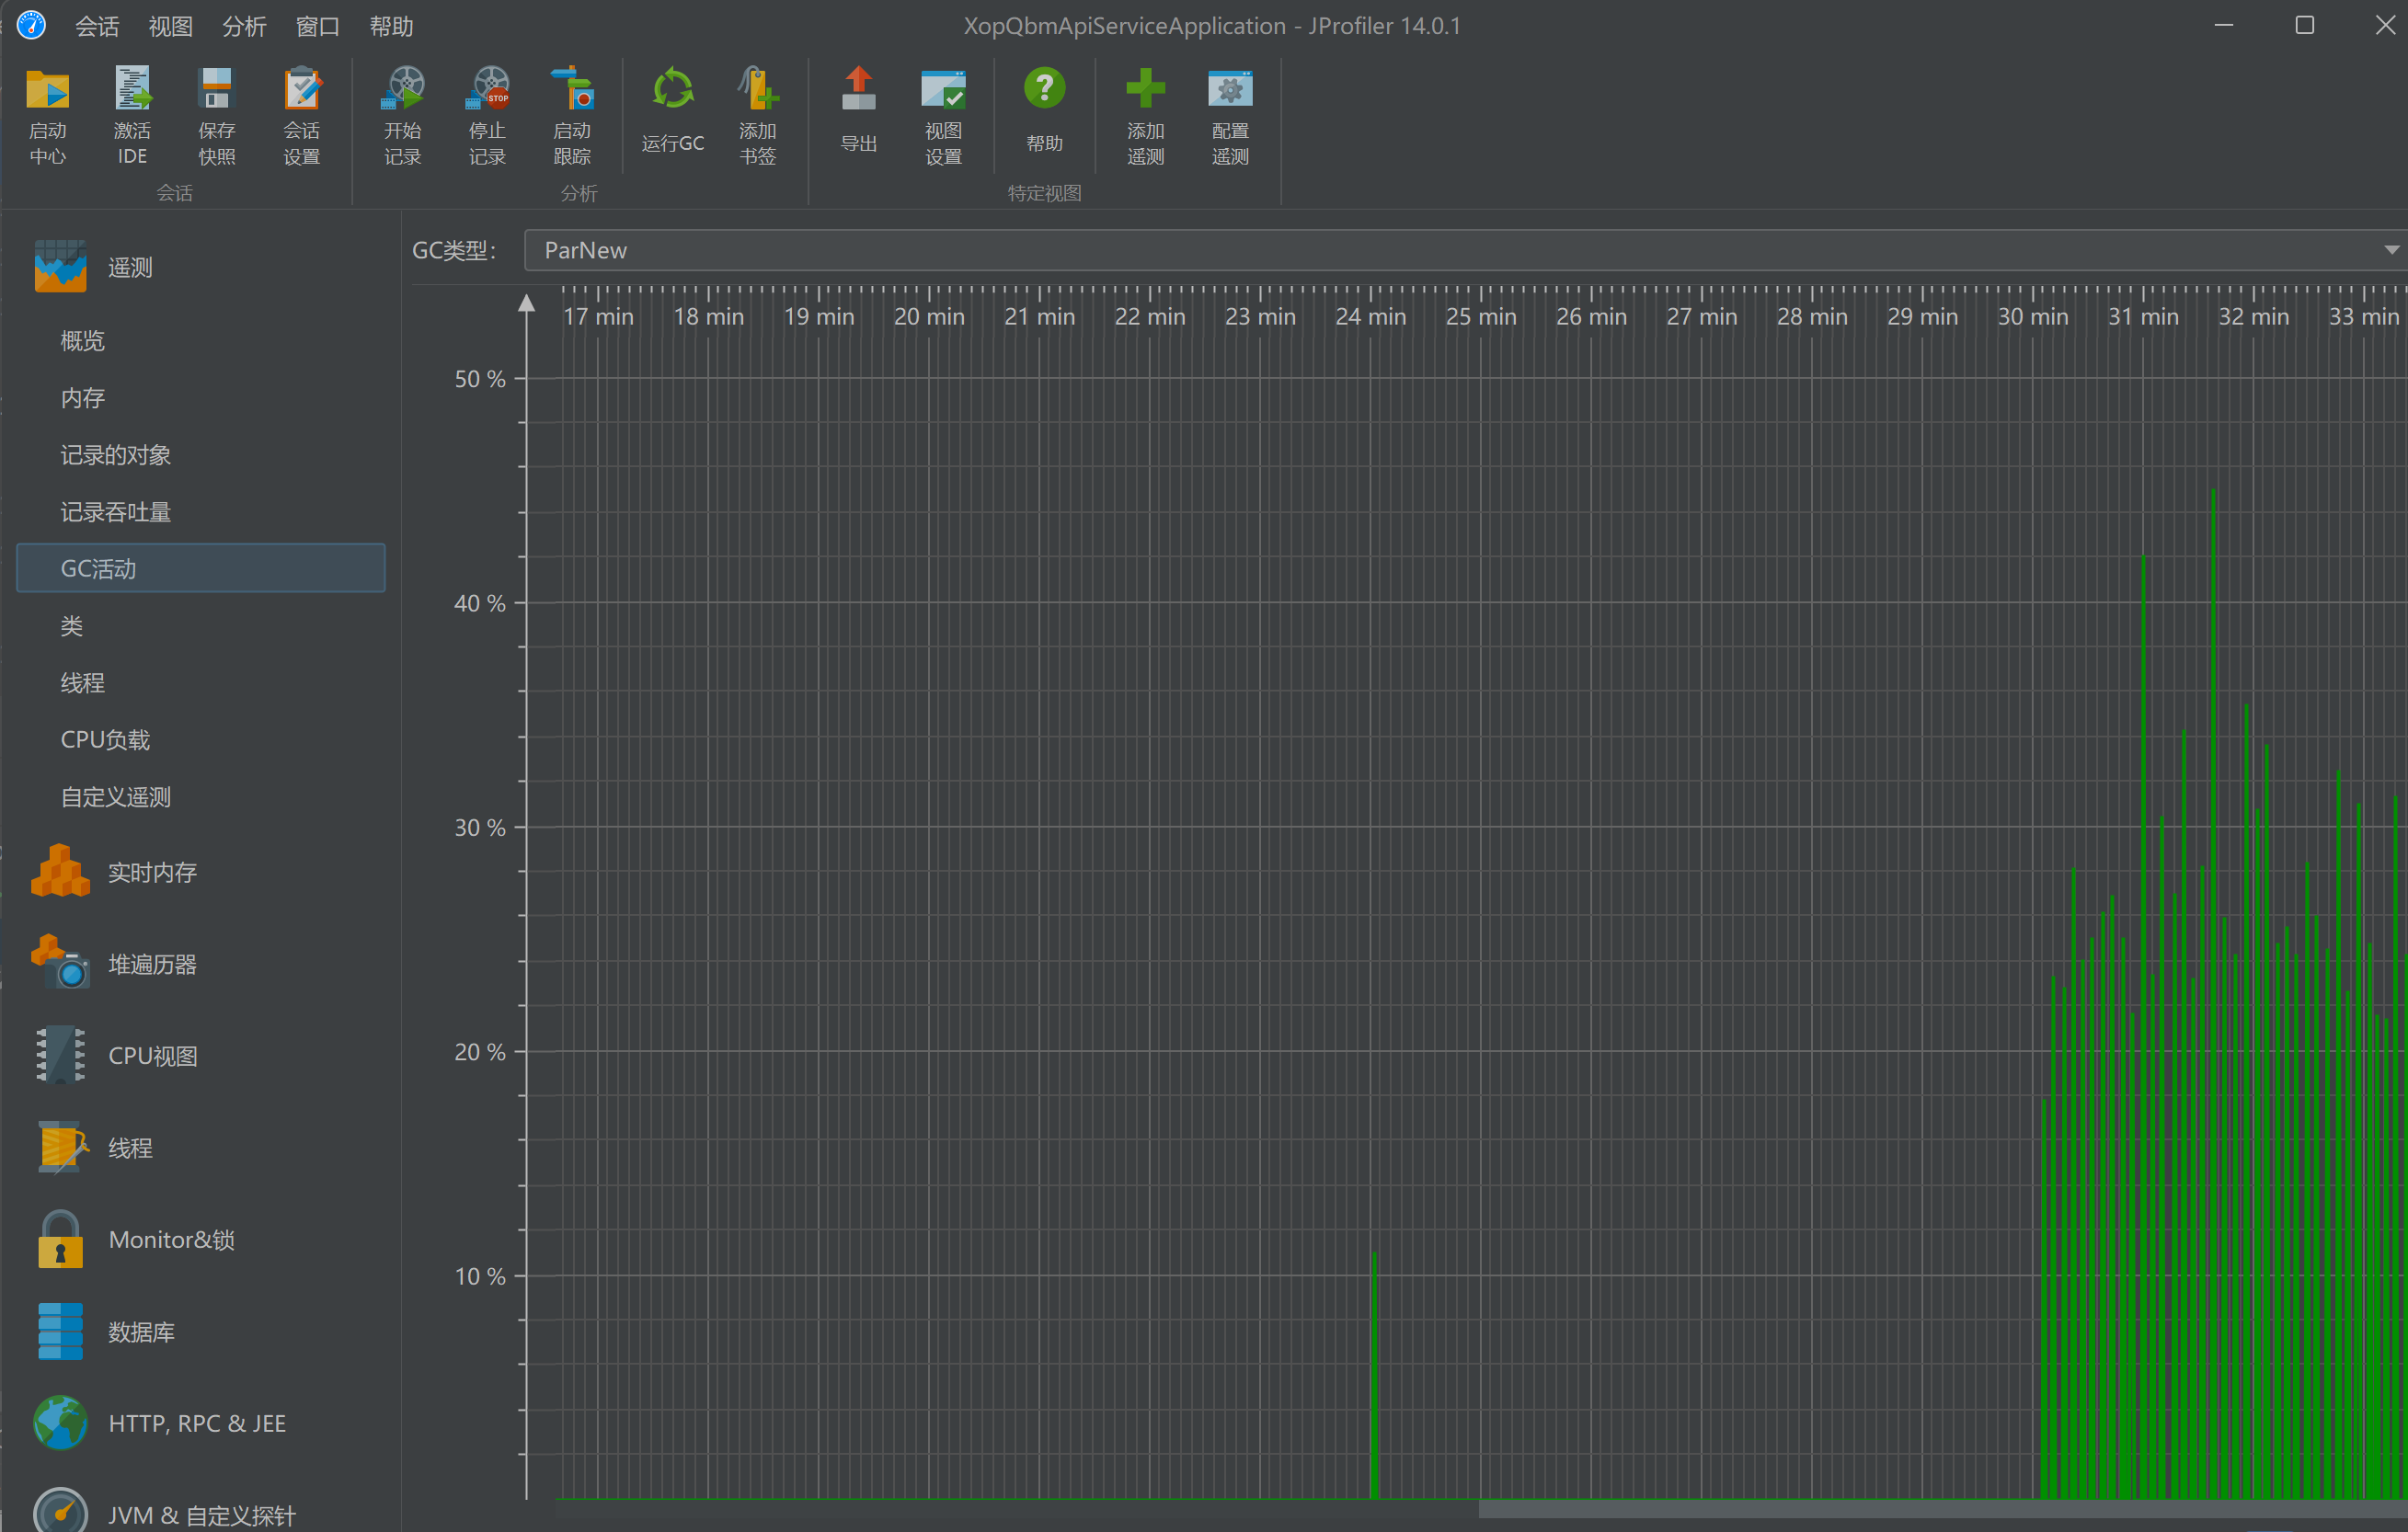
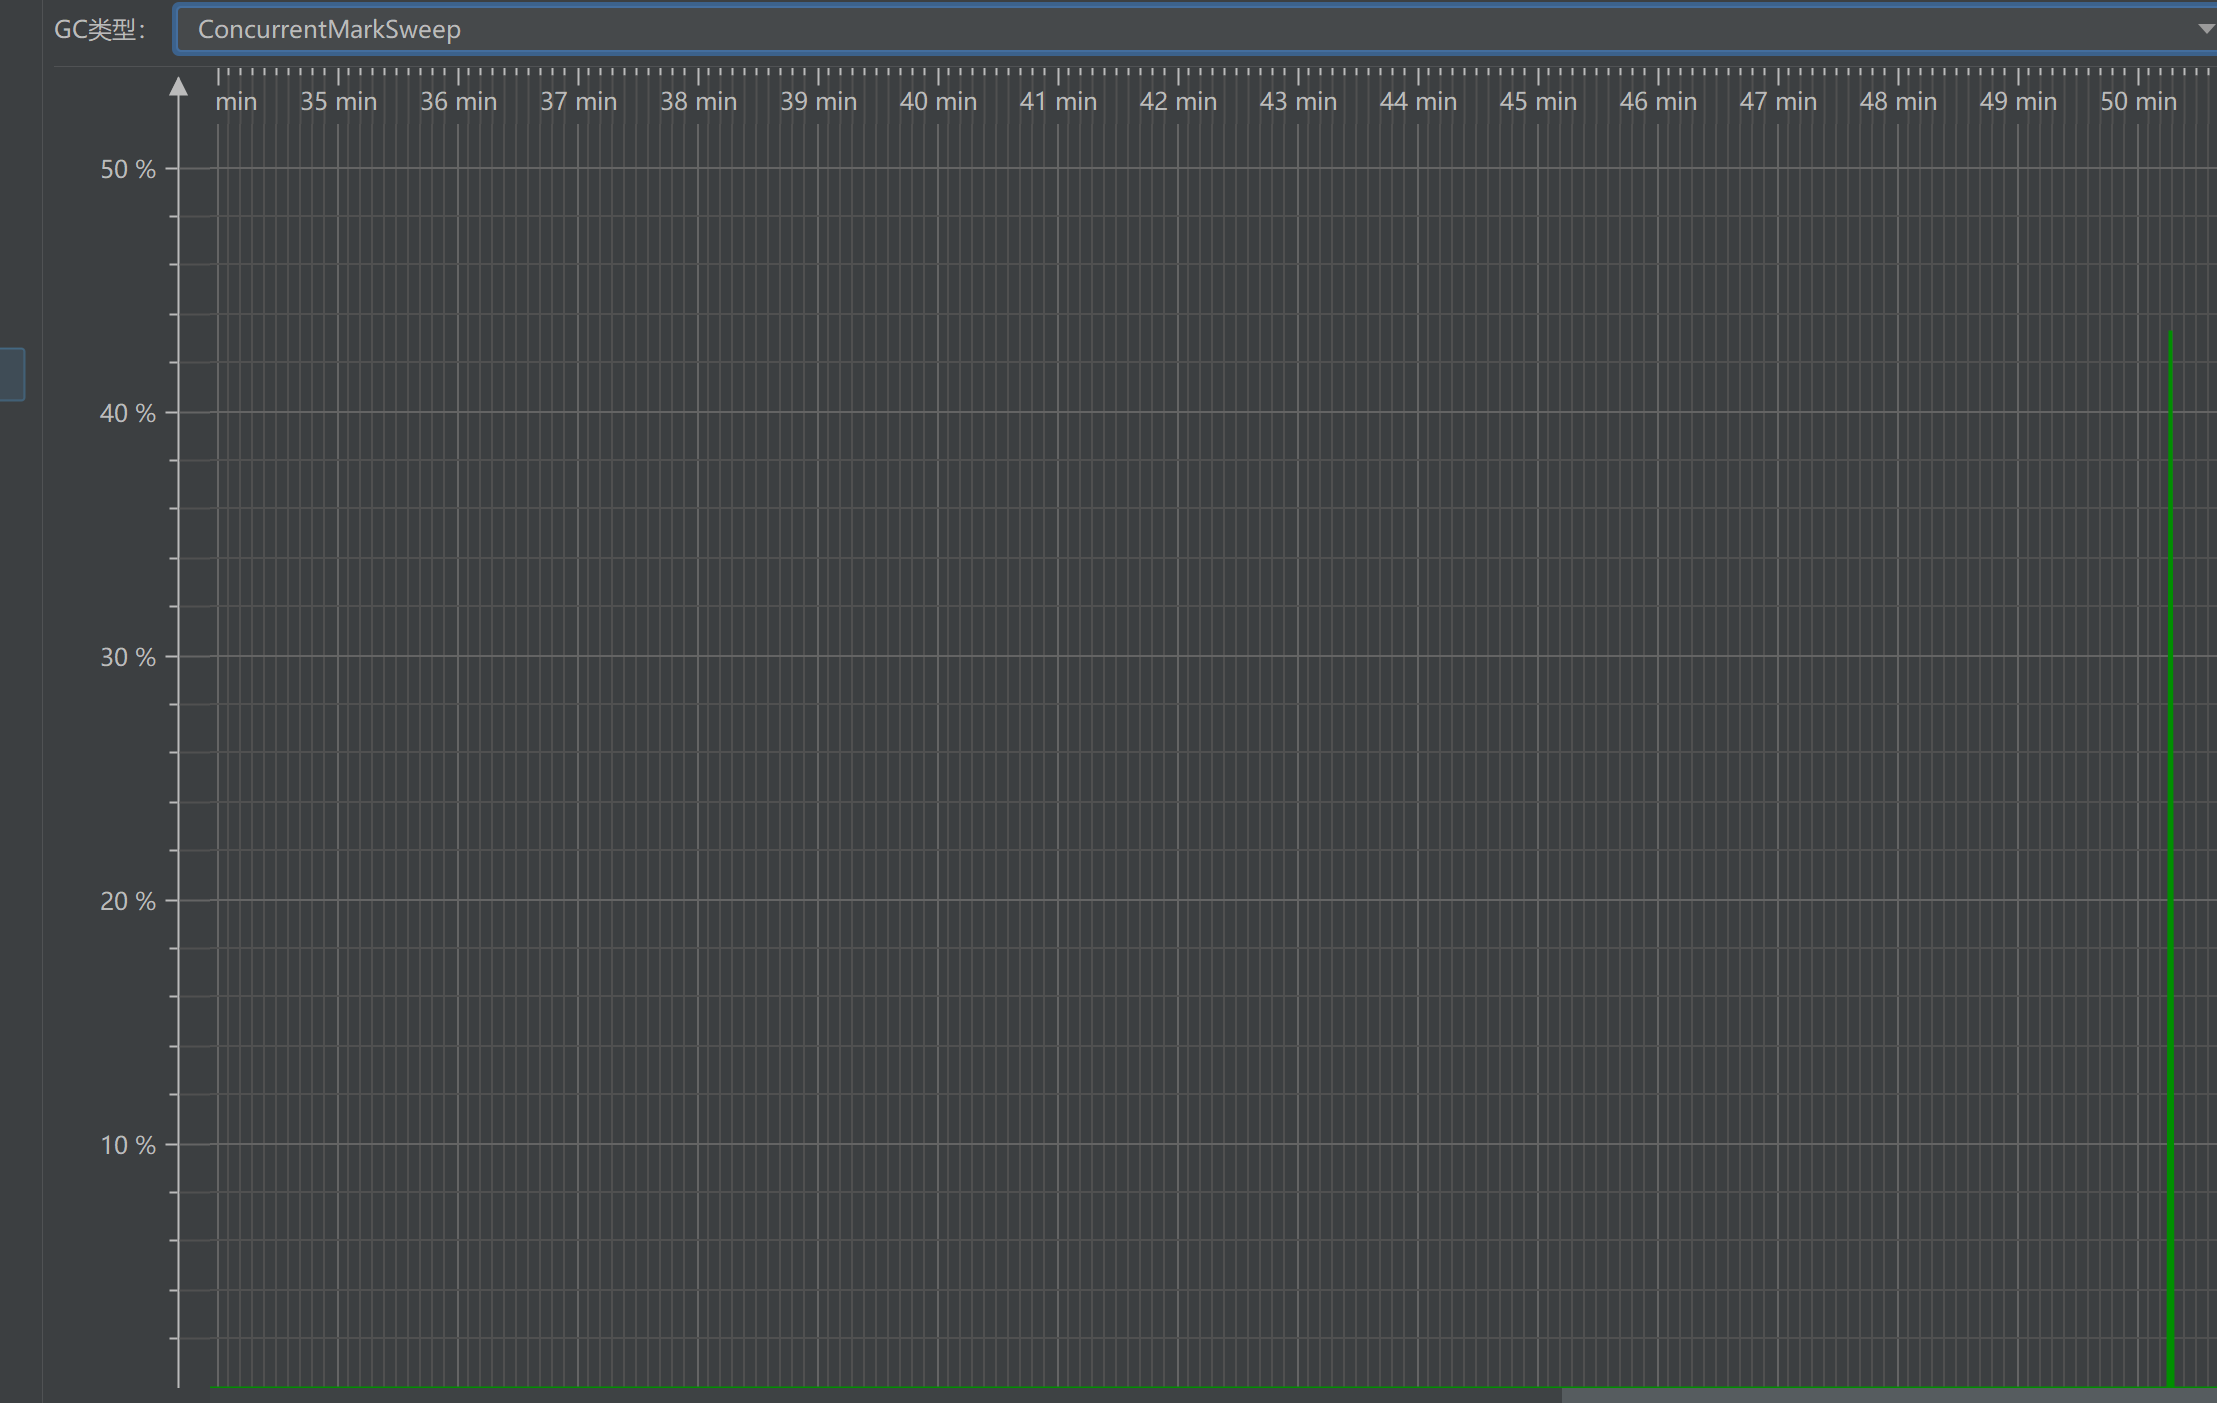
查看GC次数,期间发生了多次YoungGC,未发生FullGC。
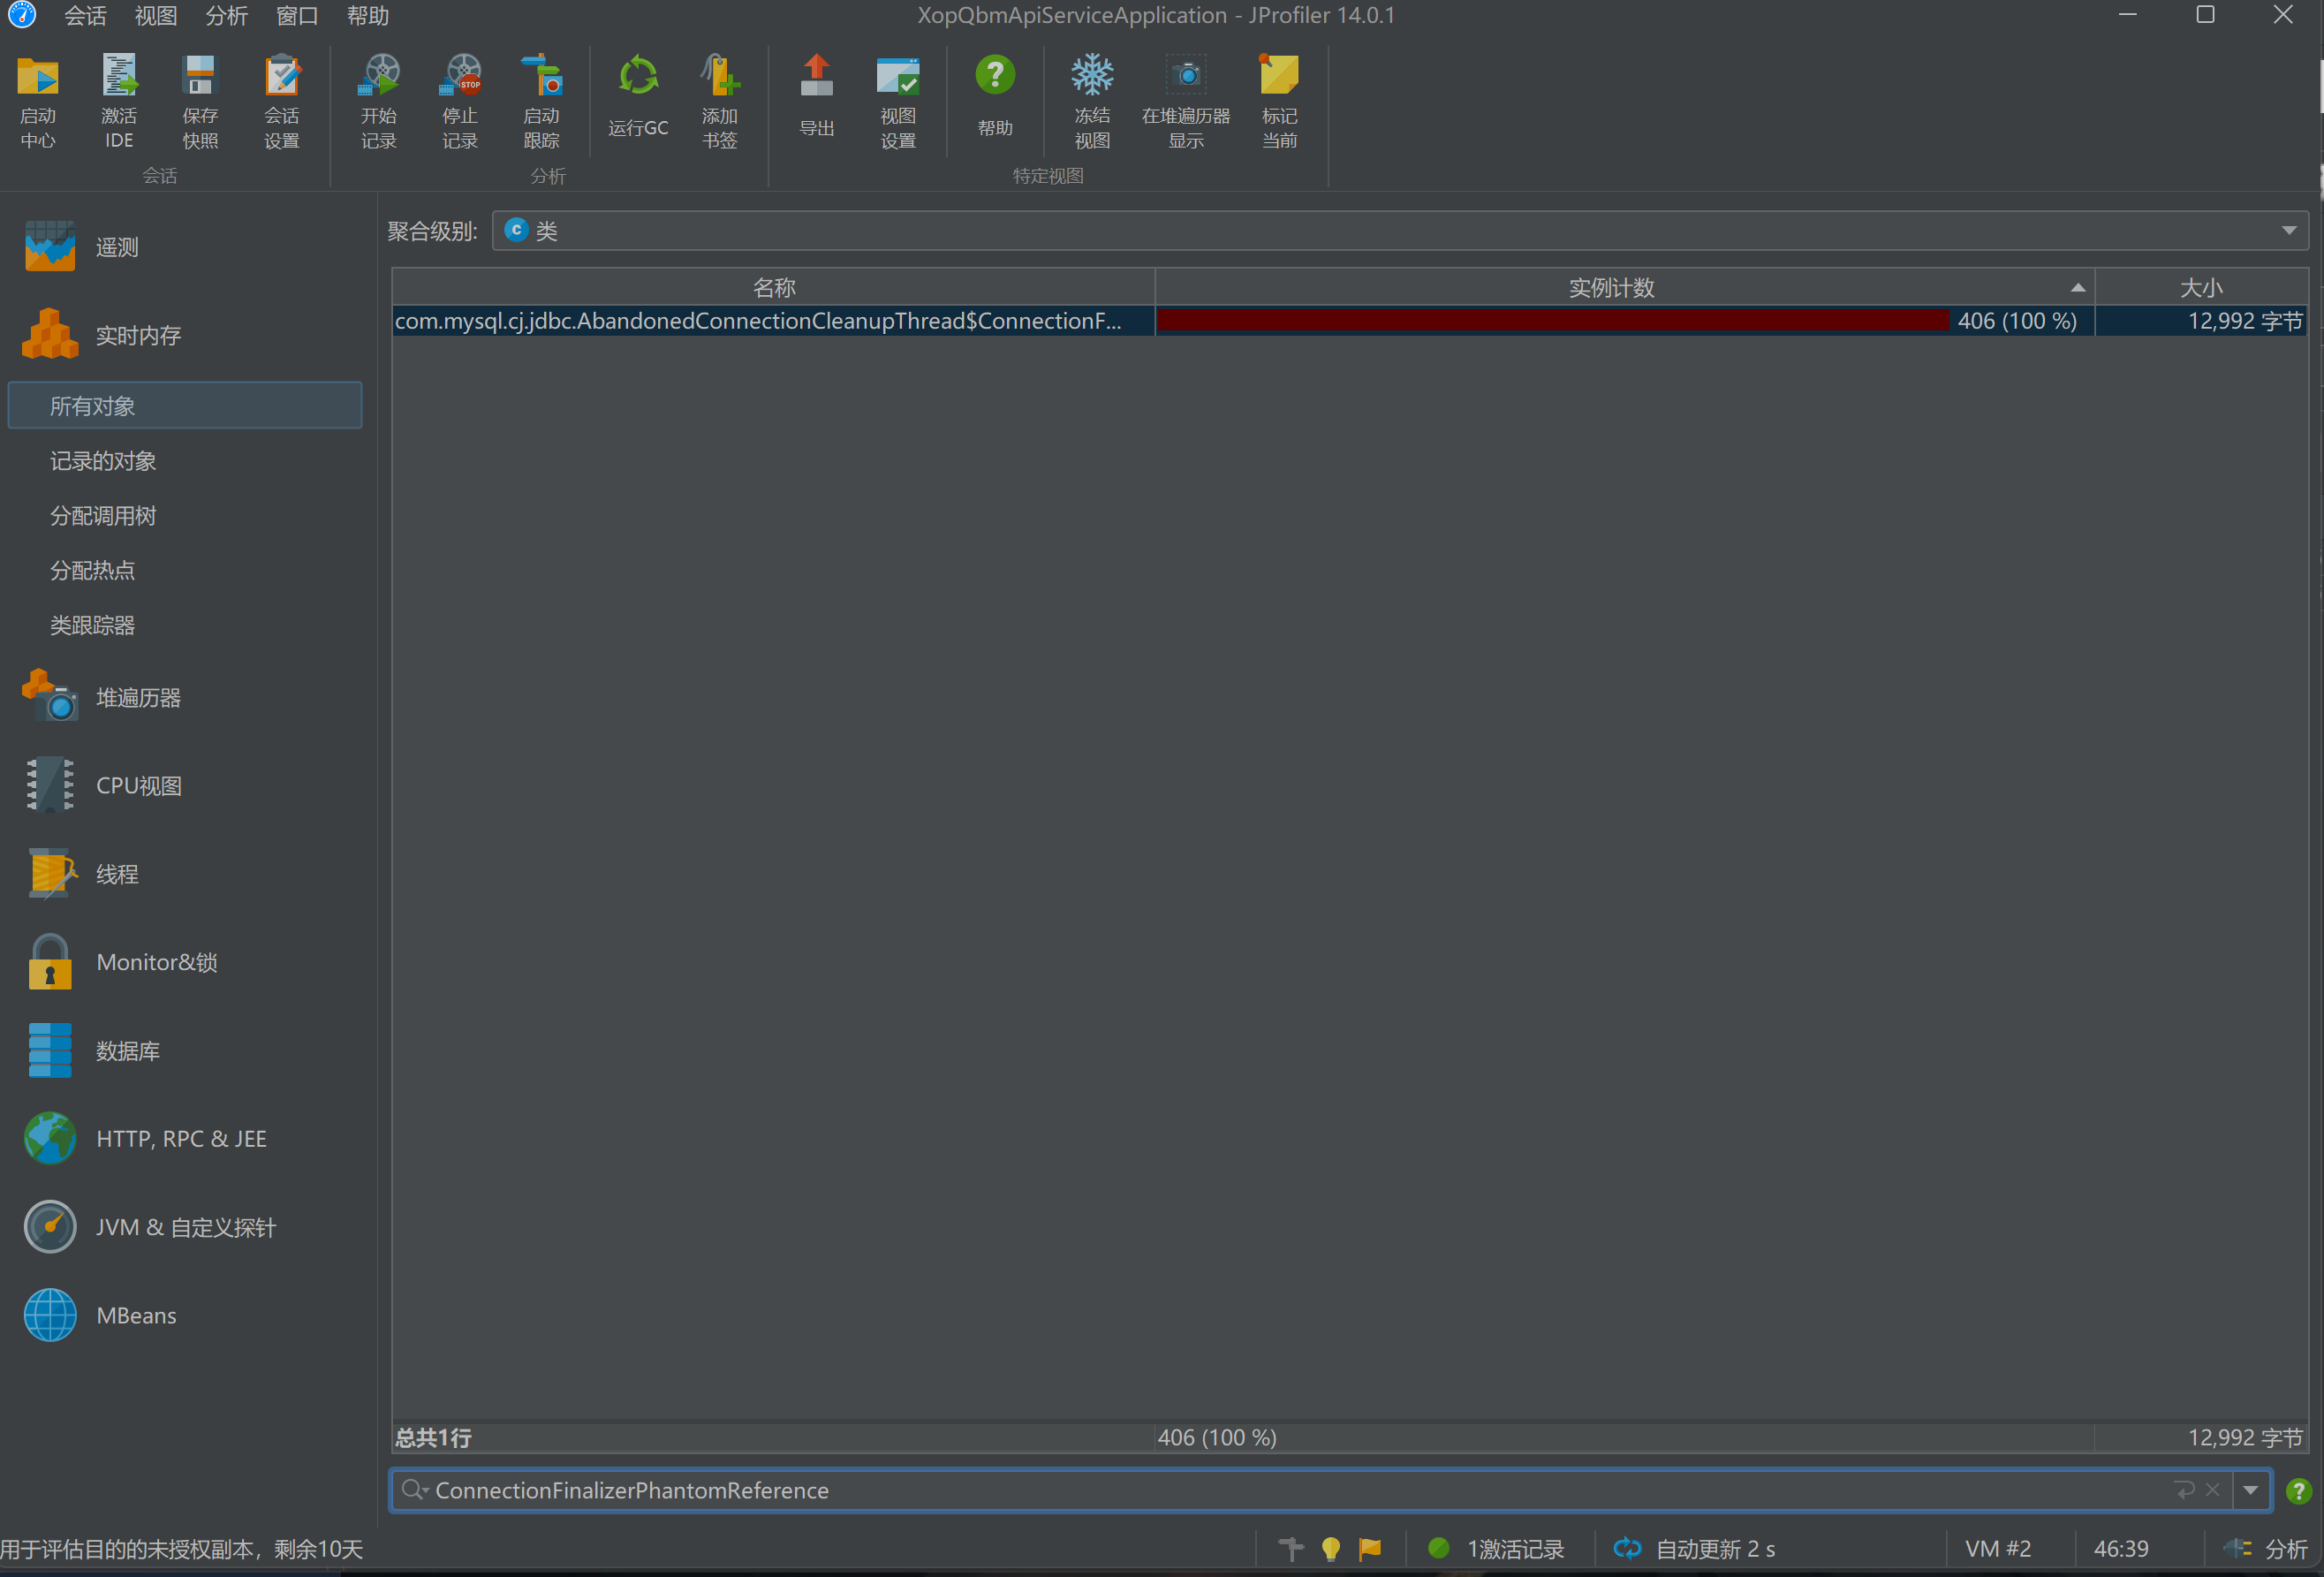
后续继续压测15min,发现ConnectionFinalizerPhantomReference对象数量堆积到老年代达到了406个。
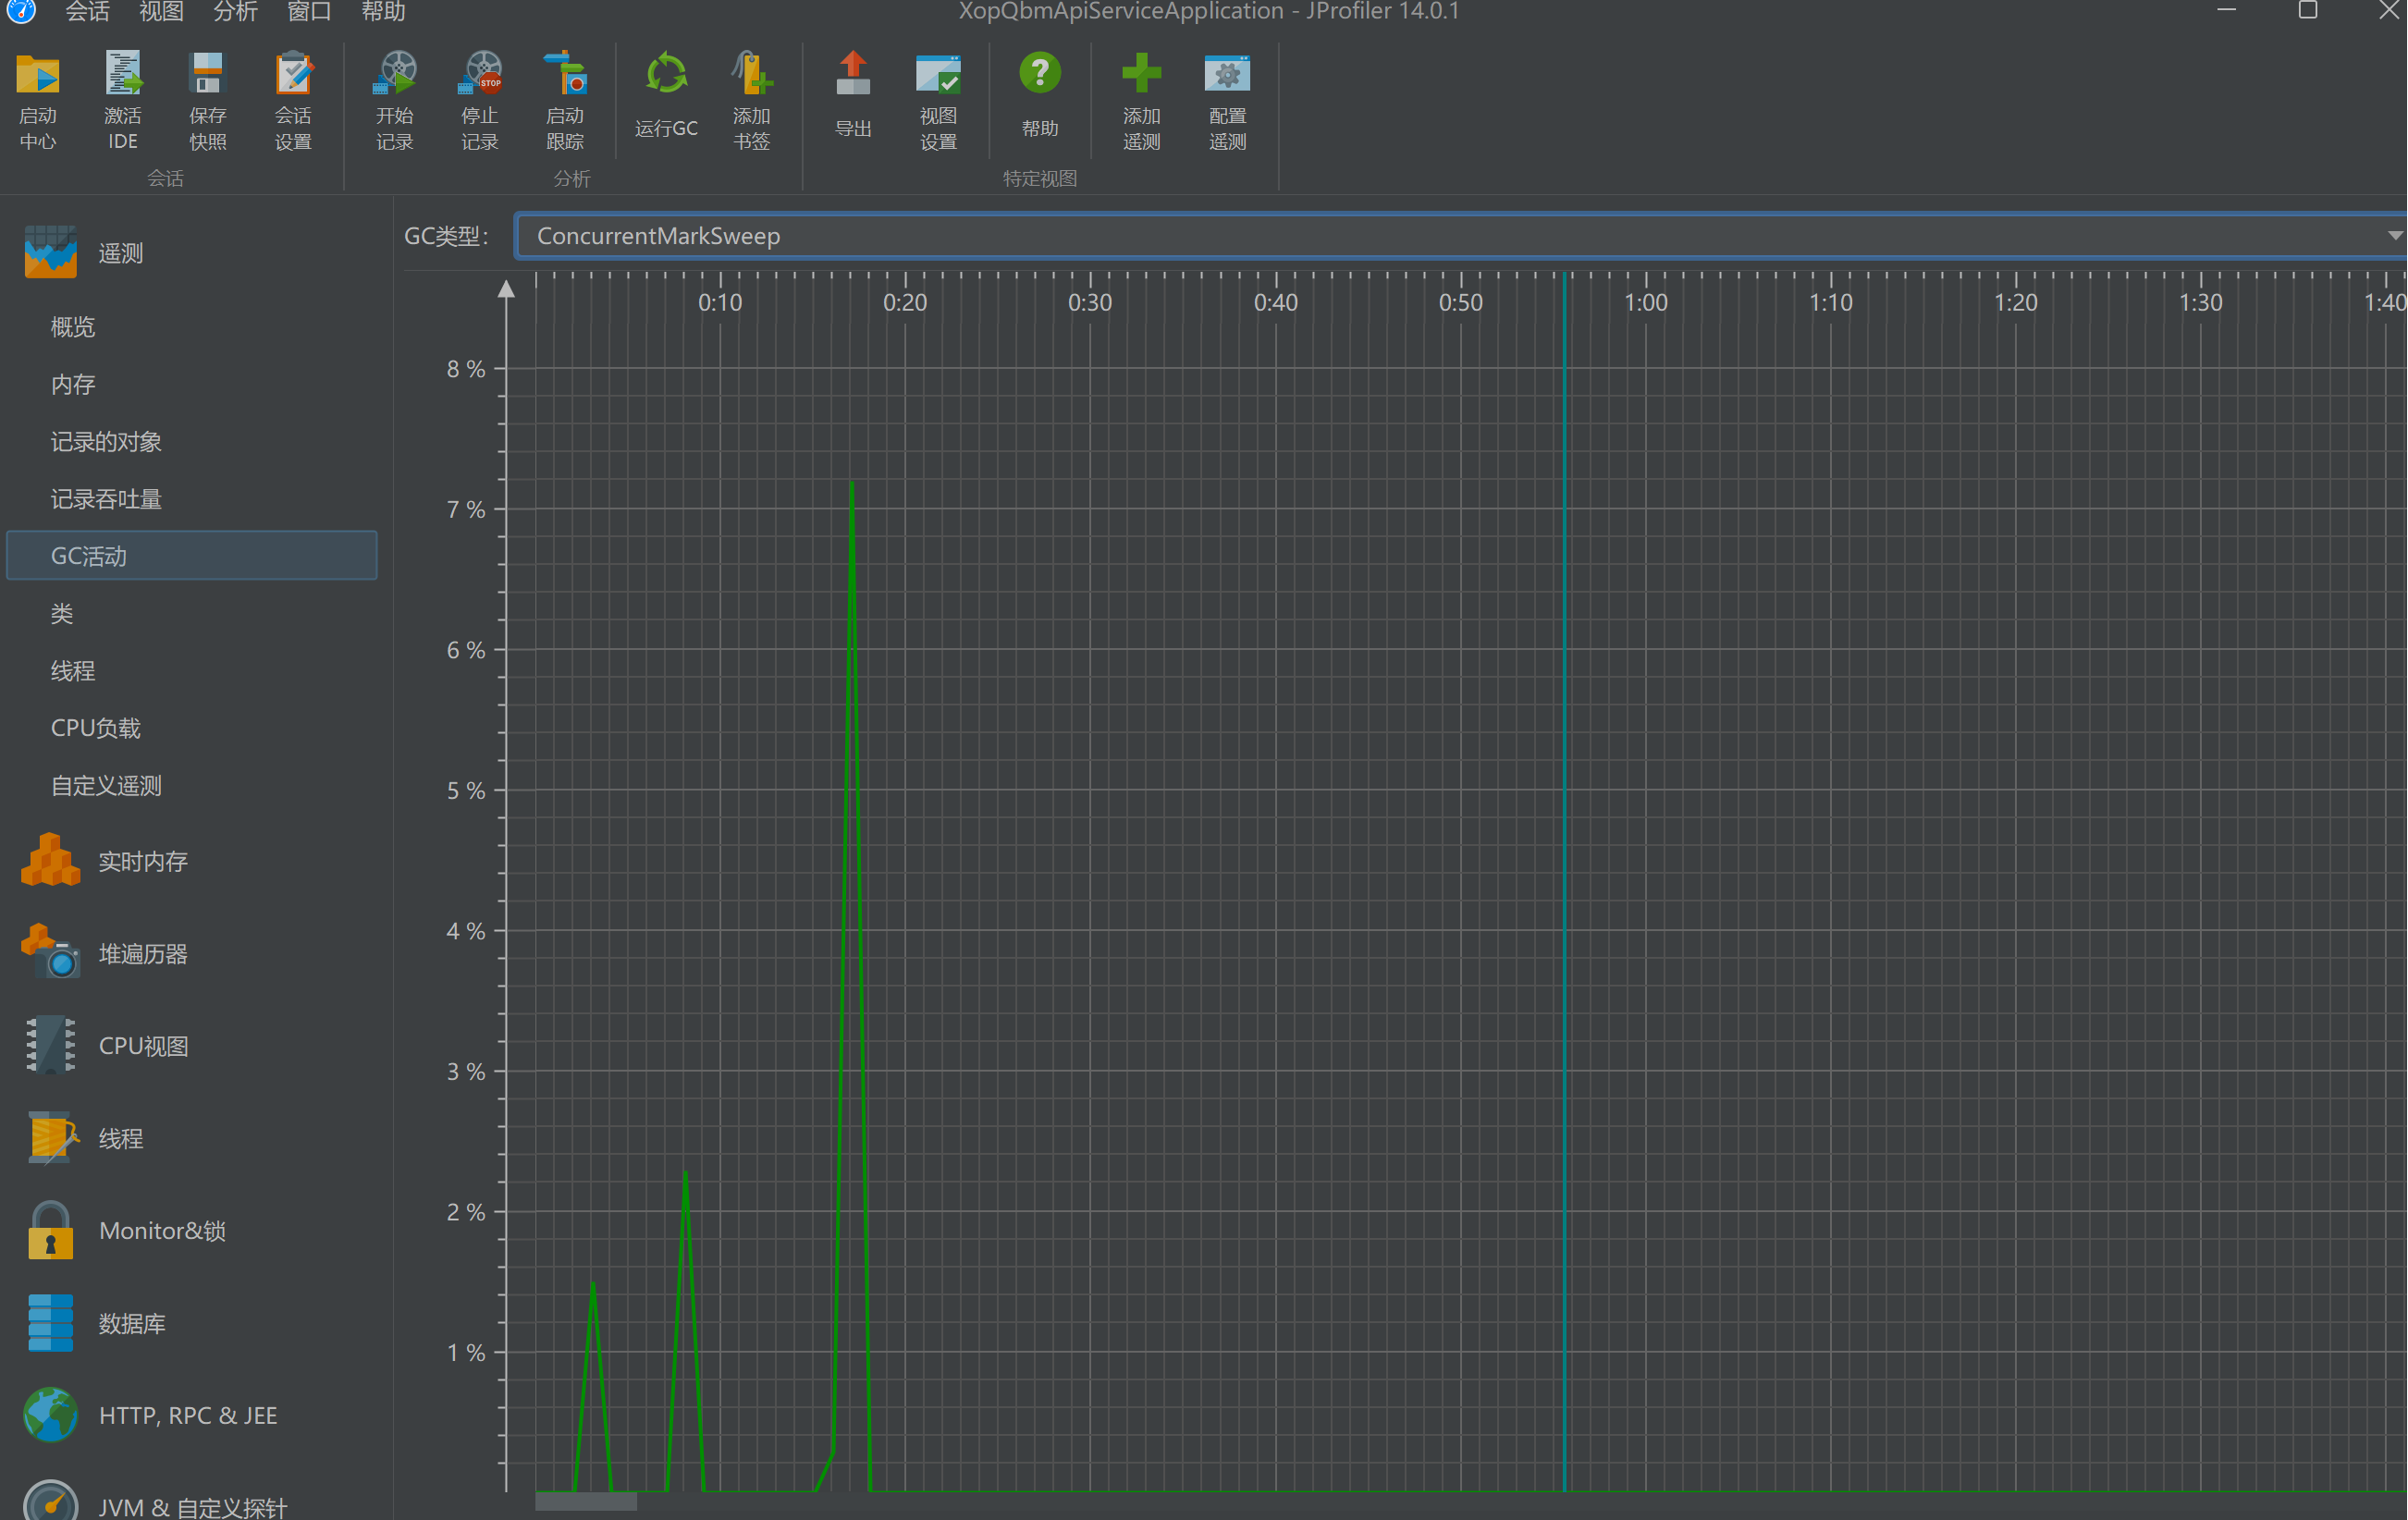
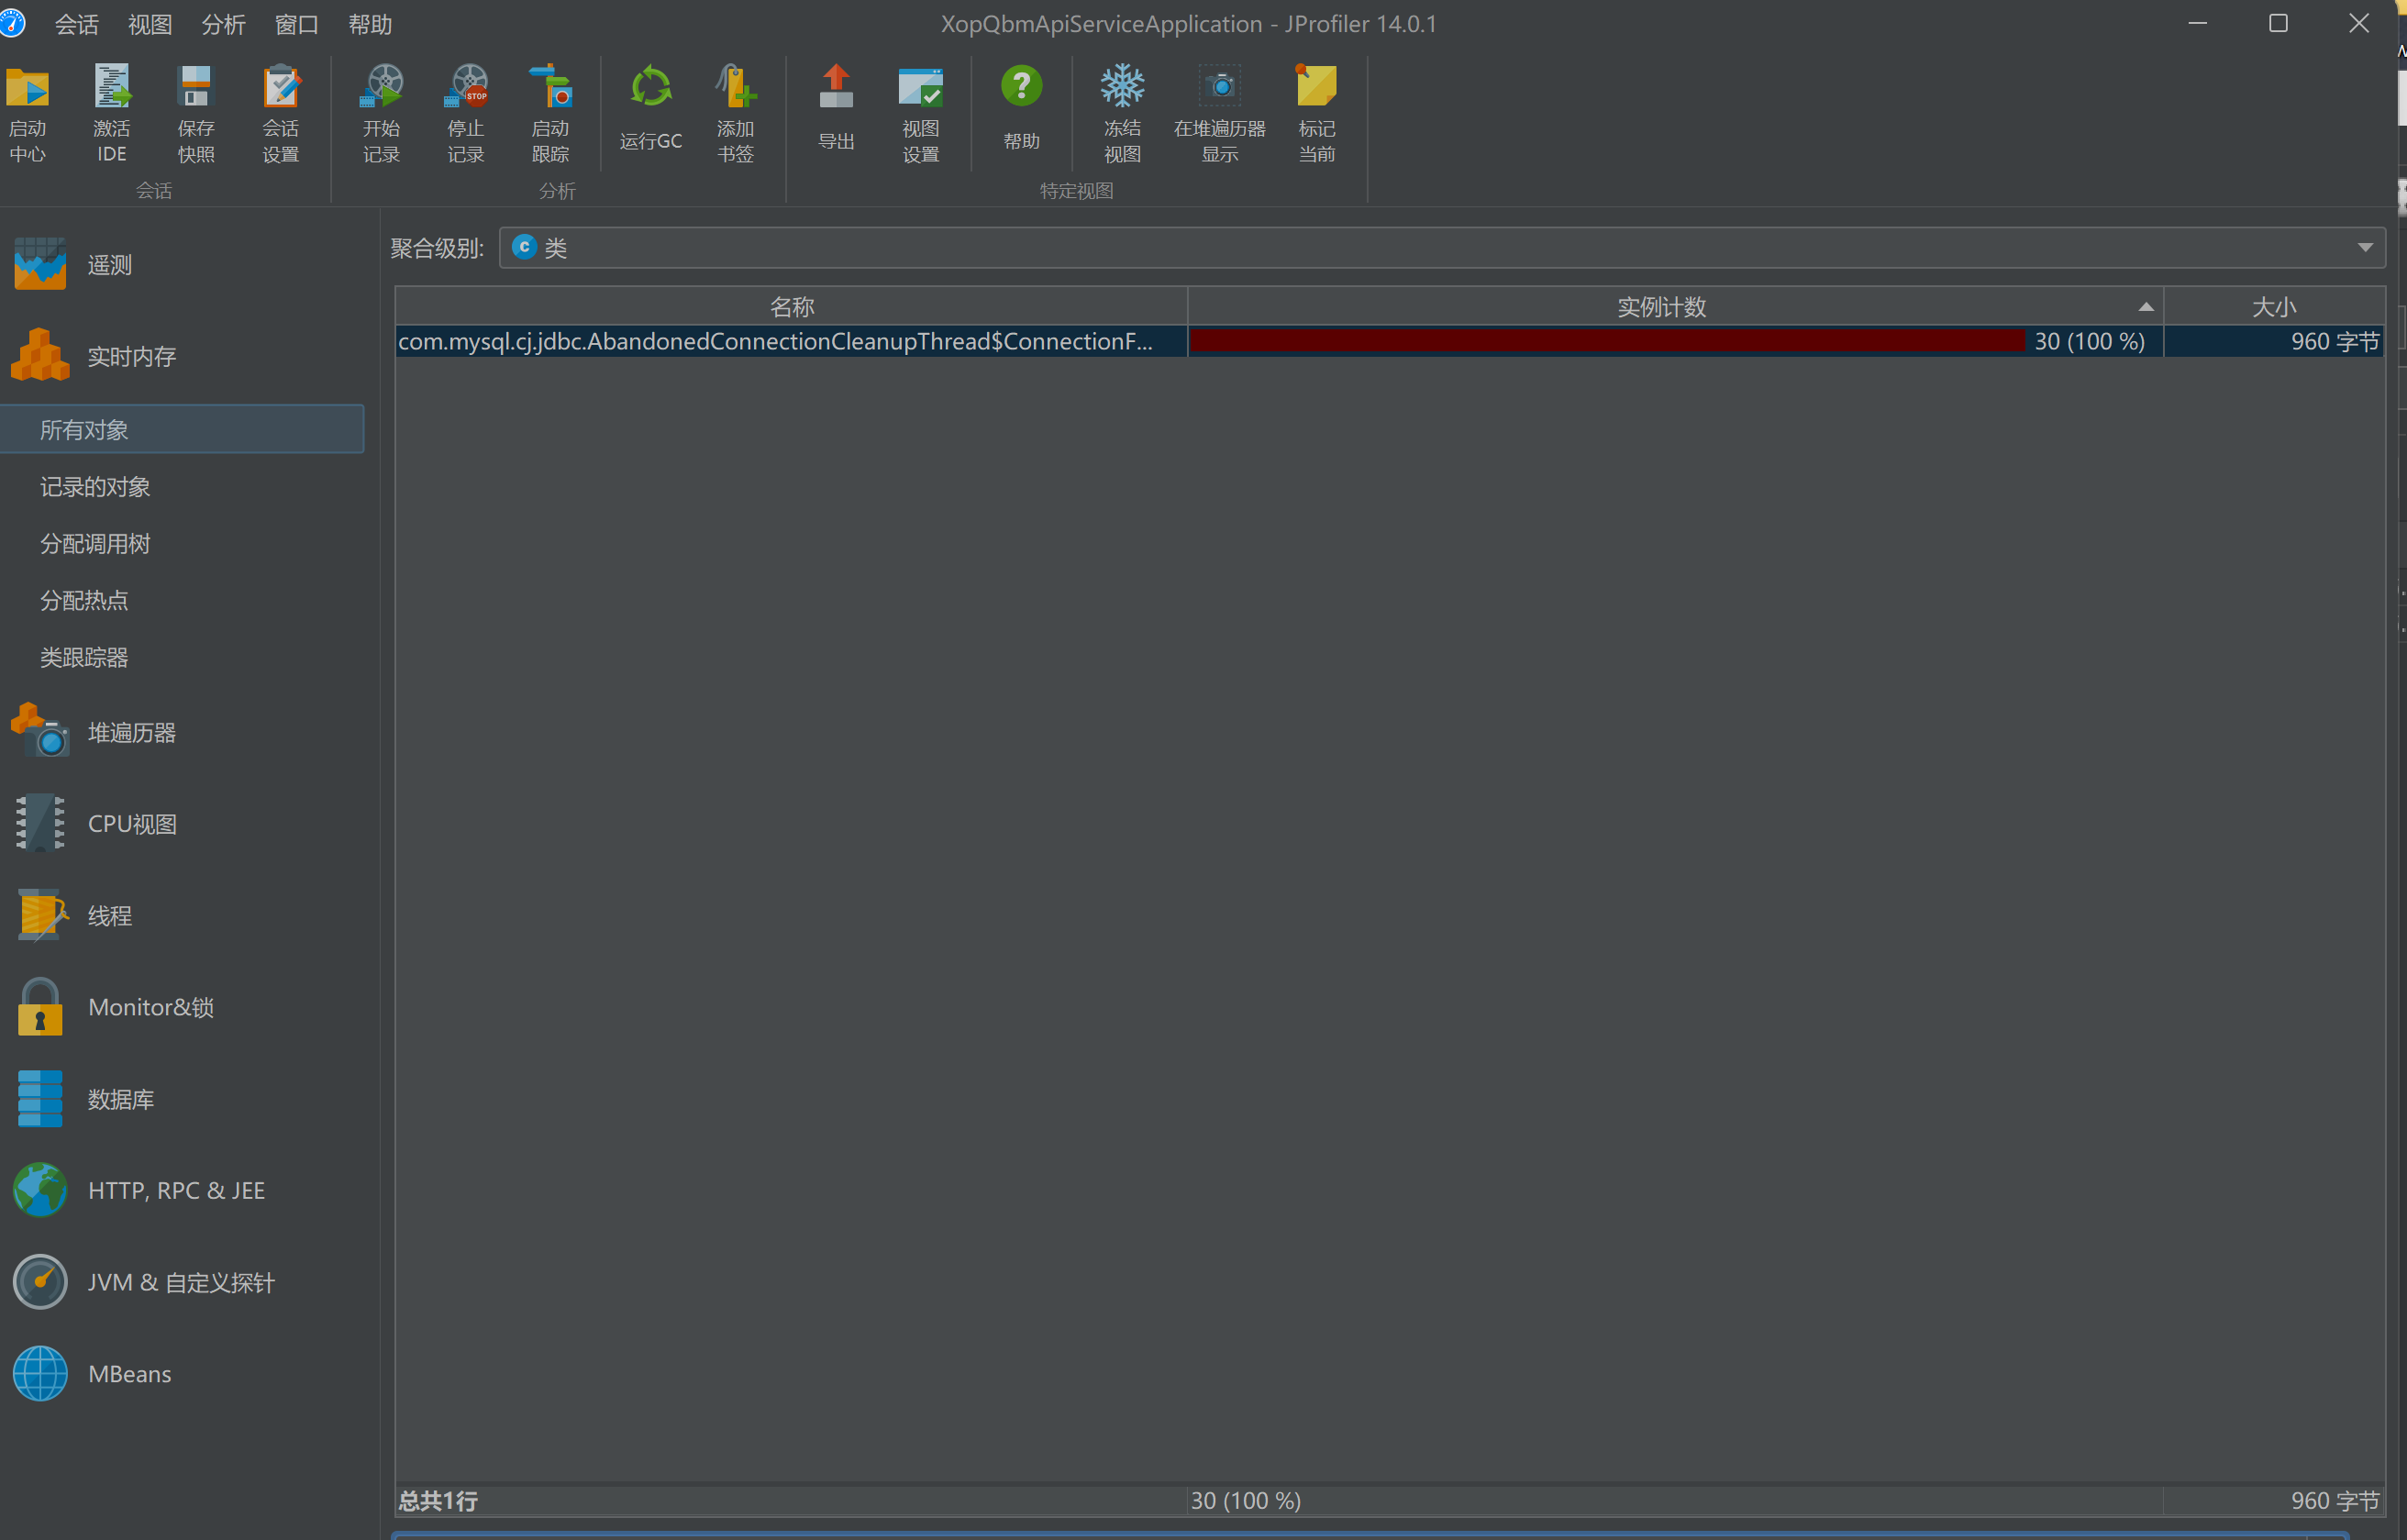
手动执行一个FullGC,观察该对象数量被清理到了30个
问题得到验证,下面调整hikariPool参数再次进行一次压测。
2、对比压测
hikariPool配置,这里设置xopqbm数据源的idle-timeout为10s,max-lifetime为100s,连接池20个,压测情况下则100s会产生20个ConnectionFinalizerPhantomReference对象,前提是不发生FullGC只发生YoungGC。
connection-timeout: 5000
idle-timeout: 1800000 // 30 min
max-lifetime: 3600000 // 1 hour
maximum-pool-size: 20
minimum-idle: 5
压测三个接口,每个接口对应一个DB源,压测时间近30min,样本近20w
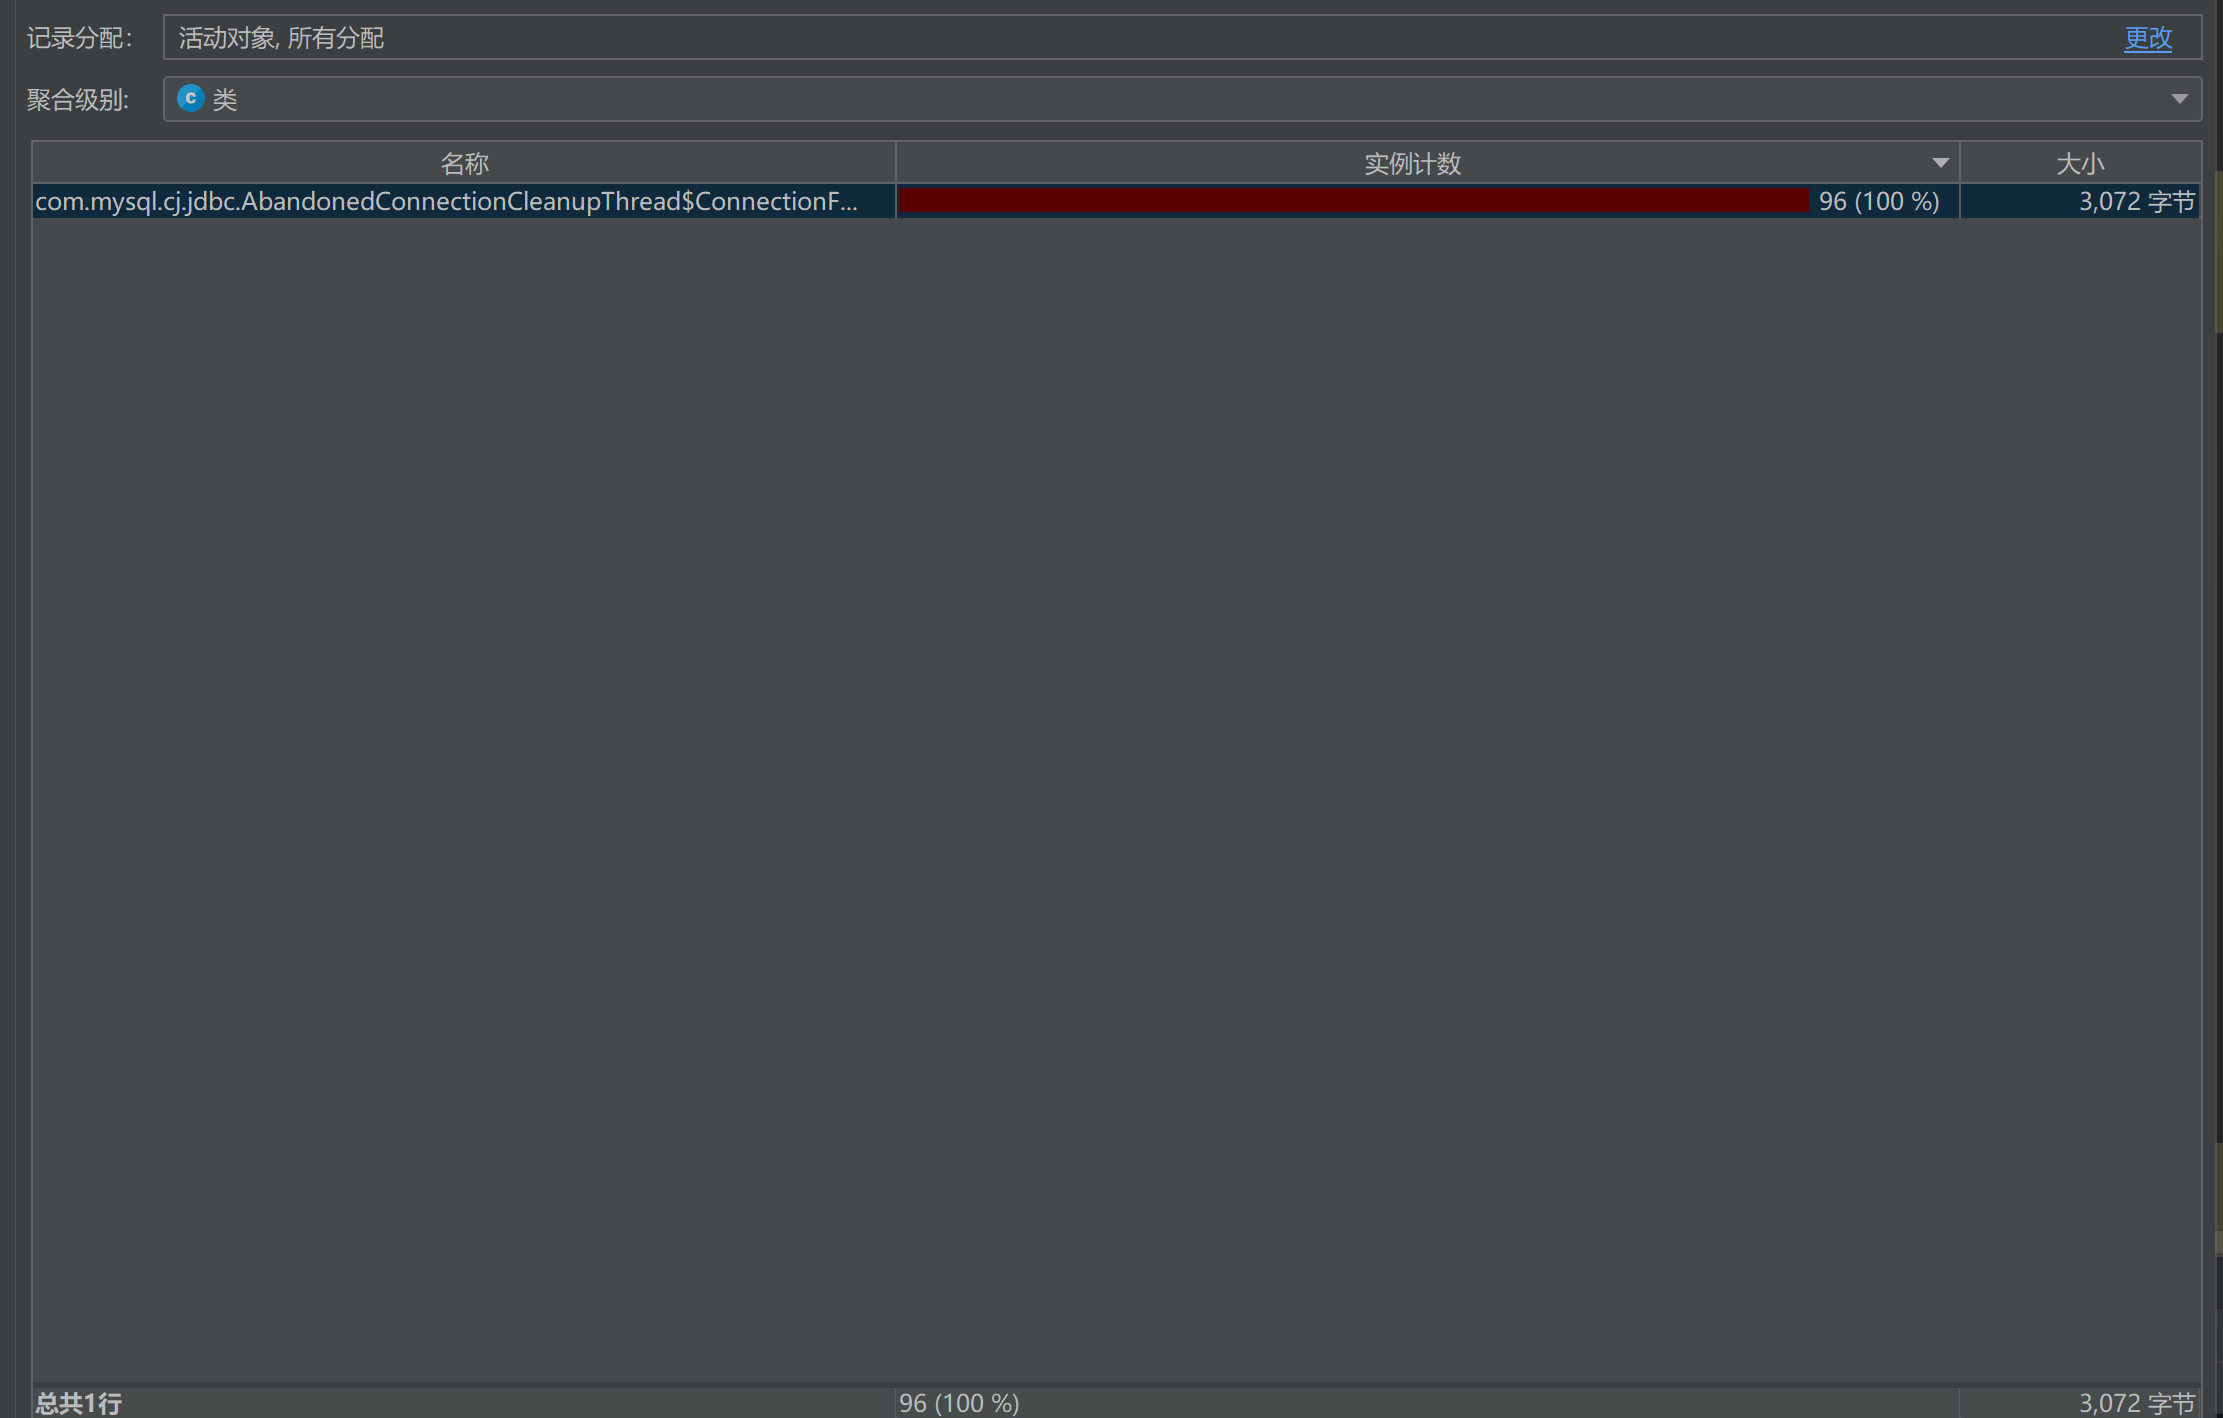
此时观察ConnectionFinalizerPhantomReference对象从手动FullGC剩下的30多个增加到了96个,相比之前情况改善了很多。
6、解决方案
首先将hikariPool的idle-timeout(空闲连接存活时间)、max-lifetime(连接最大存活时间)设置合理的值能很大程度解决该问题,合理的值需要根据数据库的wait_time尽可能将max-lifetime设置的大一些(或者直接关掉,因为连接池的这个参数指的是即使一个连接一直使用也不应该一直存活,应该定期重建),因为这杨可以在FullGC的间隔钟尽量减少数据库Connection数量,从而减少ConnectionFinalizerPhantomReference对象的堆积,进而减少FullGC的压力。
或者从根本上解决,禁止创建 ConnectionFinalizerPhantomReference对象,因为有数据库设置的也有wait_time,会超时关闭数据库连接,不会造成数据库Connection忘记关闭导致的内存泄露问题。
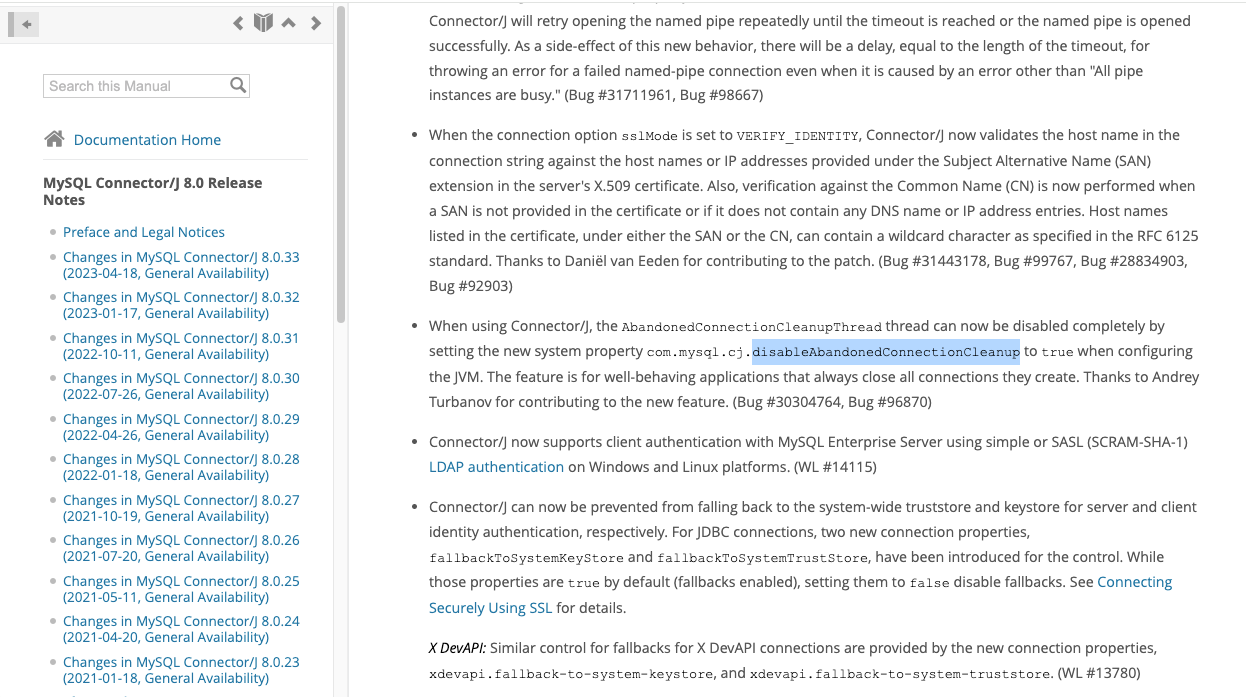
1、升级mysql-connector-java版本为8.0.22,参考https://dev.mysql.com/doc/relnotes/connector-j/8.0/en/news-8-0-22.html,然后禁用数据库连接虚引用功能 -Dcom.mysql.cj.disableAbandonedConnectionCleanup=true
2、使用定时任务清除数据库连接虚引用,在对象堆积到老年代引起FullGC的之前清除对象
// 每两小时清理 connectionPhantomRefs,减少对 FullGC 的影响
SCHEDULED_EXECUTOR.scheduleAtFixedRate(() -> {
  try {
    Field connectionPhantomRefs = NonRegisteringDriver.class.getDeclaredField("connectionPhantomRefs");
    connectionPhantomRefs.setAccessible(true);
    Map map = (Map) connectionPhantomRefs.get(NonRegisteringDriver.class);
    // 防止对象一存活进入老年代。
    if (map.size() > 50) {
      map.clear();
    }
  } catch (Exception e) {
    log.error("connectionPhantomRefs clear error!", e);
  }
}, 2, 2, TimeUnit.HOURS);
参考

一站式 AI 云服务平台
更多推荐

 11
11 0
0- 0


 已为社区贡献1条内容

所有评论(0)