
使用OpenTelemetry来监控Python应用
本文介绍了使用OpenTelemetry零代码插桩方式监控Python应用的方法。主要内容包括:1)快速部署基于Docker的Grafana LGTM作为监控后端;2)通过安装opentelemetry-distro包和自动插桩工具,实现Python应用的自动监控;3)配置环境变量并使用opentelemetry-instrument启动应用;4)展示了包含吞吐量、延迟时间、服务调用关系等关键指标
1. 前言
最近我写了一些使用OpenTelemetry监控几种编程语言(比如:Java,Node.JS)的文档,还有跨编程语言的OBI方式。当然这些文章都只介绍了非侵入式的方式,在OpenTelemetry里叫做Automatic instrumentation(自动插桩),现在又叫做Zero-code instrumentation(零代码插桩)。 其实几乎每种编程语言都有使用OpenTelemetry SDK编程的侵入式方式,适于平台开发者、商品软件提供者和希望提供精品应用的开发者,可以参考OpenTelemetry的文档。
这篇文章再介绍一下如何如何使用OpenTelemetry来监控Python应用,当然也是只讲非侵入式的方式,做起来也非常容易。
2. 启动OpenTelemetry的后端工具
OpenTelemetry的后端工具,就是支持OpenTelemetry metrics/traces/logs/profiles的数据库和UI的工具集。最常见的做法还是使用OpenTelemetry Collector来连接不同的后端工具。假如您是初学者,或者系统很小,可以直接使用基于Docker的Grafana LGTM,几乎是一键安装完成,非常简单易行。前提是需要您有个支持Docker的环境。
假设您想把LGTM安装到/opt/lgtm目录 (任何目录均可),下面是命令(假设在Linux系统):
docker pull grafana/otel-lgtm

mkdir /opt/lgtm
cd /opt/lgtm
wget https://raw.githubusercontent.com/grafana/docker-otel-lgtm/main/run-lgtm.sh
chmod +x run-lgtm.sh
sed -i 's/3000:3000/3100:3000/' run-lgtm.sh
注意最后一行命令,因为LGTM的Grafana的默认对外端口是3000,这个端口经常和一些应用程序冲突,我就改成了3100.
前面几篇文章我都在启动LGTM时激活了OBI,可以增加更多的metrics。但是如果LGTM和被监控的应用不在同一台机器时,会多出一些配置OBI的步骤。这次我干脆用默认方式(不激活OBI)。下面是启动LGTM的方法,就一个命令:
cd /opt/lgtm
./run-lgtm.sh
LGTM要监听以下的端口:
- 4317/4318 是OTLP端口,用来接受metrics/traces/logs数据
- 3100 是Grafana UI的端口
- 9090 是Prometheus的端口,用于调试
- 4040 是Pyroscope接受Profiles的端口,将来会整合进入4317/4318
3. 如何配置和启动Python应用来激活OpenTelemetry监控
1) 增加Python包:opentelemetry-distro 和 opentelemetry-exporter-otlp
一般先要进到应用使用的虚拟环境(venv, Conda之类的)。
然后可以简单地使用如下的命令安装Python包:
pip install opentelemetry-distro opentelemetry-exporter-otlp当然更正规的方式是在应用的requirements.txt里面增加两行:
opentelemetry-distro
opentelemetry-exporter-otlp
然后重新执行:
pip install -r requirements.txt2) 生成自动插桩的包
执行如下命令:
opentelemetry-bootstrap -a install该命令会针对目前安装的Python包配置响应的自动插桩的包。单独执行opentelemetry-bootstrap可以看到这些自动插桩的包。下面是我在某一个虚拟环境执行opentelemetry-bootstrap的结果:
$ opentelemetry-bootstrap
opentelemetry-instrumentation-asyncio==0.61b0
opentelemetry-instrumentation-dbapi==0.61b0
opentelemetry-instrumentation-logging==0.61b0
opentelemetry-instrumentation-sqlite3==0.61b0
opentelemetry-instrumentation-threading==0.61b0
opentelemetry-instrumentation-urllib==0.61b0
opentelemetry-instrumentation-wsgi==0.61b0
opentelemetry-instrumentation-asgi==0.61b0
opentelemetry-instrumentation-click==0.61b0
opentelemetry-instrumentation-fastapi==0.61b0
opentelemetry-instrumentation-grpc==0.61b0
opentelemetry-instrumentation-requests==0.61b0
opentelemetry-instrumentation-sqlalchemy==0.61b0
opentelemetry-instrumentation-starlette==0.61b0
opentelemetry-instrumentation-tortoiseorm==0.61b0
opentelemetry-instrumentation-urllib3==0.61b0
3) 使用 opentelemetry-instrument 启动应用
假如您启动应用的命令是:
python app.py那可以改成如下命令来启动应用,同时激活OpenTelemetry:
export OTEL_SERVICE_NAME=python-demo
export OTEL_EXPORTER_OTLP_ENDPOINT=http://localhost:4317
export OTEL_TRACES_EXPORTER=otlp
export OTEL_METRICS_EXPORTER=otlp
export OTEL_LOGS_EXPORTER=otlp

cd /opt/dev/otel/otel-python-demo/
opentelemetry-instrument python app.py
当然也可以用uvicorn或者gunicorn。假如您启动应用的命令是:
uvicorn app:app --host 0.0.0.0 --port 8000那可以改成如下命令来启动应用,同时激活OpenTelemetry:
export OTEL_SERVICE_NAME=python-demo
export OTEL_EXPORTER_OTLP_ENDPOINT=http://localhost:4317
export OTEL_TRACES_EXPORTER=otlp
export OTEL_METRICS_EXPORTER=otlp
export OTEL_LOGS_EXPORTER=otlp

cd /opt/dev/otel/otel-python-demo/
opentelemetry-instrument uvicorn app:app --host 0.0.0.0 --port 8000
注意:
- 按照您自己的应用内容来修改OTEL_SERVICE_NAME环境变量
- 如果OpenTelemetry后端(本例采用LGTM)不在本机,假如在1.2.3.4,则设置响应的OTEL_EXPORTER_OTLP_ENDPOINT为
export OTEL_EXPORTER_OTLP_ENDPOINT=http://1.2.3.4:43174. 监控Python应用的Dashboard
使用“http://localhost:3100”就可以访问LGTM的Grafana UI界面(如果是远程的话,用主机名或者IP替换localhost),使用admin/admin登录。虽然LGTM支持各种类型的数据:metrics/traces/logs/profiles,但是由于OpenTelemetry对Python的自动监控目前只支持metrics/traces,所以我们的Grafana Dashboard只能有这两种数据。
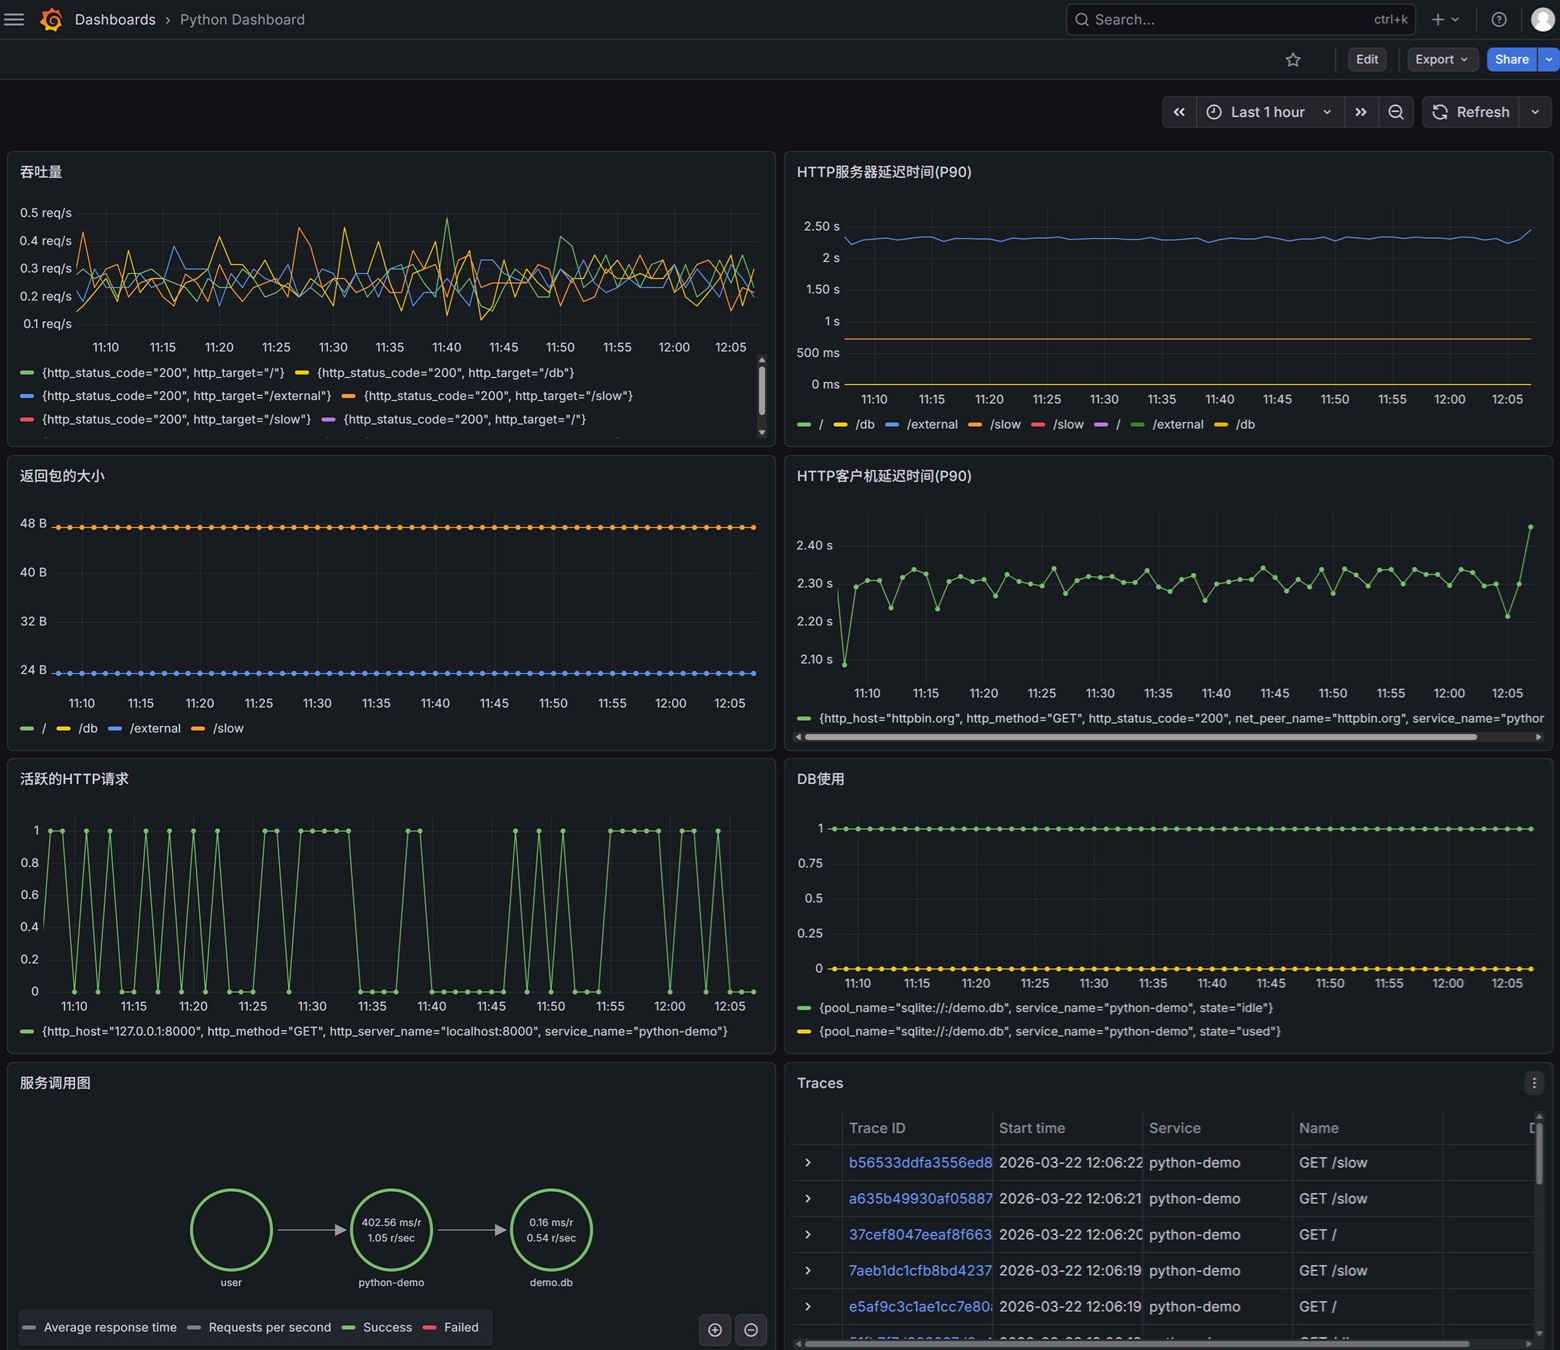
以下是我做的Dashboard的截图:
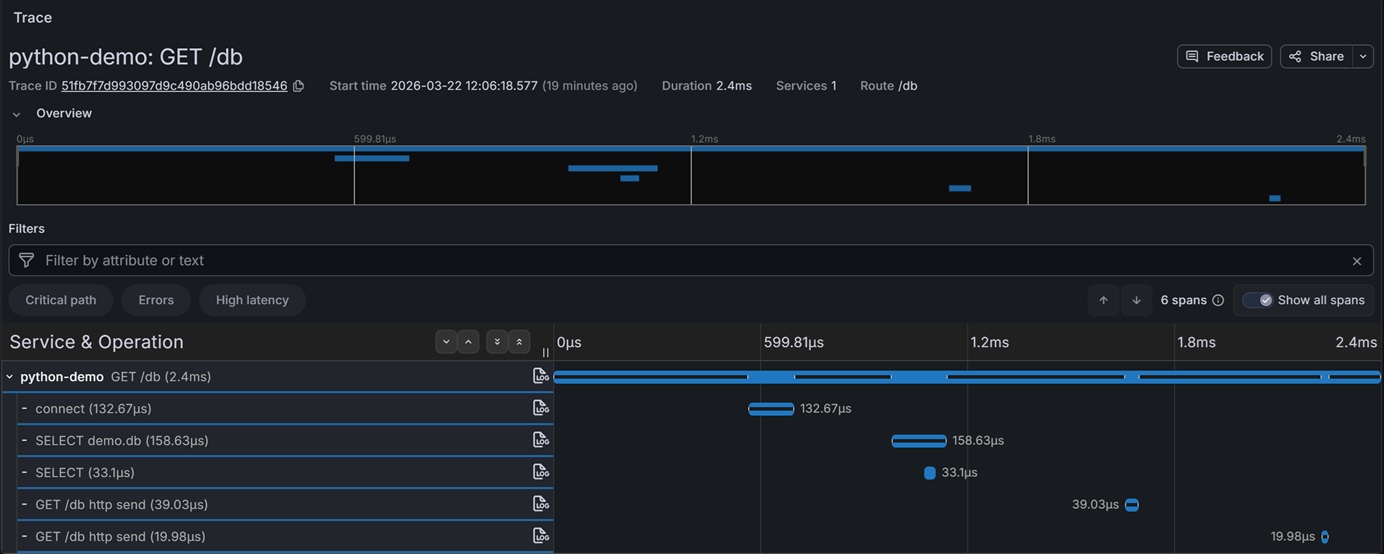
以下是点击某一个Trace的截图:
我简单介绍一下这个Dashboard:
第一行左图是描述吞吐量,主要的PromQL是:
sum by (http_target, http_status_code) (
  rate(http_server_duration_milliseconds_count[2m])
)
第一行右图是描述HTTP服务器延迟时间(90%),主要的PromQL是:
histogram_quantile(0.90, sum by (le, http_target) (rate(http_server_duration_milliseconds_bucket[2m])))第二行左图是描述返回包的大小,主要的PromQL是:
histogram_quantile(0.90, sum by (le, http_target) (rate(http_server_response_size_bytes_bucket[2m])))第二行右图是描述HTTP客户机延迟时间(P90),主要的PromQL是:
histogram_quantile(0.90, sum without (http_flavor,http_scheme,job) (rate(http_client_duration_milliseconds_bucket[2m])))第三行左图是描述活跃的HTTP请求数,主要的PromQL是:
sum without (__name__,job,http_flavor,http_scheme) (http_server_active_requests)第三行右图是描述DB连接数,主要的PromQL是:
avg without (__name__,job) (
  db_client_connections_usage
)
第四行左图是描述服务之间的调用关系。
第四行右图是所有Traces。
以下是整个Dashboard的代码,可以直接导入。
{
"annotations": {
"list": [
{
"builtIn": 1,
"datasource": {
"type": "grafana",
"uid": "-- Grafana --"
},
"enable": true,
"hide": true,
"iconColor": "rgba(0, 211, 255, 1)",
"name": "Annotations & Alerts",
"type": "dashboard"
}
]
},
"editable": true,
"fiscalYearStartMonth": 0,
"graphTooltip": 0,
"links": [],
"panels": [
{
"datasource": {
"type": "prometheus",
"uid": "prometheus"
},
"fieldConfig": {
"defaults": {
"color": {
"mode": "palette-classic"
},
"custom": {
"axisBorderShow": false,
"axisCenteredZero": false,
"axisColorMode": "text",
"axisLabel": "",
"axisPlacement": "auto",
"barAlignment": 0,
"barWidthFactor": 0.6,
"drawStyle": "line",
"fillOpacity": 0,
"gradientMode": "none",
"hideFrom": {
"legend": false,
"tooltip": false,
"viz": false
},
"insertNulls": false,
"lineInterpolation": "linear",
"lineStyle": {
"fill": "solid"
},
"lineWidth": 1,
"pointSize": 5,
"scaleDistribution": {
"type": "linear"
},
"showPoints": "never",
"showValues": false,
"spanNulls": false,
"stacking": {
"group": "A",
"mode": "none"
},
"thresholdsStyle": {
"mode": "off"
}
},
"mappings": [],
"thresholds": {
"mode": "absolute",
"steps": [
{
"color": "green",
"value": 0
},
{
"color": "red",
"value": 80
}
]
},
"unit": "reqps"
},
"overrides": []
},
"gridPos": {
"h": 8,
"w": 12,
"x": 0,
"y": 0
},
"id": 2,
"options": {
"legend": {
"calcs": [],
"displayMode": "list",
"placement": "bottom",
"showLegend": true
},
"tooltip": {
"hideZeros": false,
"mode": "single",
"sort": "none"
}
},
"pluginVersion": "12.4.1",
"targets": [
{
"datasource": {
"type": "prometheus",
"uid": "prometheus"
},
"editorMode": "code",
"expr": "sum by (http_target, http_status_code) (\r\n rate(http_server_duration_milliseconds_count[2m])\r\n)",
"instant": true,
"interval": "",
"legendFormat": "__auto",
"range": true,
"refId": "A"
}
],
"title": "吞吐量",
"type": "timeseries"
},
{
"datasource": {
"type": "prometheus",
"uid": "prometheus"
},
"fieldConfig": {
"defaults": {
"color": {
"mode": "palette-classic"
},
"custom": {
"axisBorderShow": false,
"axisCenteredZero": false,
"axisColorMode": "text",
"axisLabel": "",
"axisPlacement": "auto",
"barAlignment": 0,
"barWidthFactor": 0.6,
"drawStyle": "line",
"fillOpacity": 0,
"gradientMode": "none",
"hideFrom": {
"legend": false,
"tooltip": false,
"viz": false
},
"insertNulls": false,
"lineInterpolation": "linear",
"lineWidth": 1,
"pointSize": 5,
"scaleDistribution": {
"type": "linear"
},
"showPoints": "never",
"showValues": false,
"spanNulls": false,
"stacking": {
"group": "A",
"mode": "none"
},
"thresholdsStyle": {
"mode": "off"
}
},
"mappings": [],
"thresholds": {
"mode": "absolute",
"steps": [
{
"color": "green",
"value": 0
},
{
"color": "red",
"value": 80
}
]
},
"unit": "ms"
},
"overrides": []
},
"gridPos": {
"h": 8,
"w": 12,
"x": 12,
"y": 0
},
"id": 1,
"options": {
"legend": {
"calcs": [],
"displayMode": "list",
"placement": "bottom",
"showLegend": true
},
"tooltip": {
"hideZeros": false,
"mode": "single",
"sort": "none"
}
},
"pluginVersion": "12.4.1",
"targets": [
{
"datasource": {
"type": "prometheus",
"uid": "prometheus"
},
"editorMode": "code",
"expr": "histogram_quantile(0.90, sum by (le, http_target) (rate(http_server_duration_milliseconds_bucket[2m])))",
"instant": true,
"legendFormat": "__auto",
"range": true,
"refId": "A"
}
],
"title": "HTTP服务器延迟时间(P90)",
"type": "timeseries"
},
{
"datasource": {
"type": "prometheus",
"uid": "prometheus"
},
"fieldConfig": {
"defaults": {
"color": {
"mode": "palette-classic"
},
"custom": {
"axisBorderShow": false,
"axisCenteredZero": false,
"axisColorMode": "text",
"axisLabel": "",
"axisPlacement": "auto",
"barAlignment": 0,
"barWidthFactor": 0.6,
"drawStyle": "line",
"fillOpacity": 0,
"gradientMode": "none",
"hideFrom": {
"legend": false,
"tooltip": false,
"viz": false
},
"insertNulls": false,
"lineInterpolation": "linear",
"lineWidth": 1,
"pointSize": 5,
"scaleDistribution": {
"type": "linear"
},
"showPoints": "auto",
"showValues": false,
"spanNulls": false,
"stacking": {
"group": "A",
"mode": "none"
},
"thresholdsStyle": {
"mode": "off"
}
},
"mappings": [],
"thresholds": {
"mode": "absolute",
"steps": [
{
"color": "green",
"value": 0
},
{
"color": "red",
"value": 80
}
]
},
"unit": "bytes"
},
"overrides": []
},
"gridPos": {
"h": 8,
"w": 12,
"x": 0,
"y": 8
},
"id": 3,
"options": {
"legend": {
"calcs": [],
"displayMode": "list",
"placement": "bottom",
"showLegend": true
},
"tooltip": {
"hideZeros": false,
"mode": "single",
"sort": "none"
}
},
"pluginVersion": "12.4.1",
"targets": [
{
"datasource": {
"type": "prometheus",
"uid": "prometheus"
},
"editorMode": "code",
"expr": "histogram_quantile(0.90, sum by (le, http_target) (rate(http_server_response_size_bytes_bucket[2m])))",
"instant": false,
"legendFormat": "__auto",
"range": true,
"refId": "A"
}
],
"title": "返回包的大小",
"type": "timeseries"
},
{
"datasource": {
"type": "prometheus",
"uid": "prometheus"
},
"fieldConfig": {
"defaults": {
"color": {
"mode": "palette-classic"
},
"custom": {
"axisBorderShow": false,
"axisCenteredZero": false,
"axisColorMode": "text",
"axisLabel": "",
"axisPlacement": "auto",
"barAlignment": 0,
"barWidthFactor": 0.6,
"drawStyle": "line",
"fillOpacity": 0,
"gradientMode": "none",
"hideFrom": {
"legend": false,
"tooltip": false,
"viz": false
},
"insertNulls": false,
"lineInterpolation": "linear",
"lineWidth": 1,
"pointSize": 5,
"scaleDistribution": {
"type": "linear"
},
"showPoints": "auto",
"showValues": false,
"spanNulls": false,
"stacking": {
"group": "A",
"mode": "none"
},
"thresholdsStyle": {
"mode": "off"
}
},
"mappings": [],
"thresholds": {
"mode": "absolute",
"steps": [
{
"color": "green",
"value": 0
},
{
"color": "red",
"value": 80
}
]
},
"unit": "ms"
},
"overrides": []
},
"gridPos": {
"h": 8,
"w": 12,
"x": 12,
"y": 8
},
"id": 5,
"options": {
"legend": {
"calcs": [],
"displayMode": "list",
"placement": "bottom",
"showLegend": true
},
"tooltip": {
"hideZeros": false,
"mode": "single",
"sort": "none"
}
},
"pluginVersion": "12.4.1",
"targets": [
{
"datasource": {
"type": "prometheus",
"uid": "prometheus"
},
"editorMode": "code",
"expr": "histogram_quantile(0.90, sum without (http_flavor,http_scheme,job) (rate(http_client_duration_milliseconds_bucket[2m])))",
"instant": false,
"legendFormat": "__auto",
"range": true,
"refId": "A"
}
],
"title": "HTTP客户机延迟时间(P90)",
"type": "timeseries"
},
{
"datasource": {
"type": "prometheus",
"uid": "prometheus"
},
"fieldConfig": {
"defaults": {
"color": {
"mode": "palette-classic"
},
"custom": {
"axisBorderShow": false,
"axisCenteredZero": false,
"axisColorMode": "text",
"axisLabel": "",
"axisPlacement": "auto",
"barAlignment": 0,
"barWidthFactor": 0.6,
"drawStyle": "line",
"fillOpacity": 0,
"gradientMode": "none",
"hideFrom": {
"legend": false,
"tooltip": false,
"viz": false
},
"insertNulls": false,
"lineInterpolation": "linear",
"lineWidth": 1,
"pointSize": 5,
"scaleDistribution": {
"type": "linear"
},
"showPoints": "auto",
"showValues": false,
"spanNulls": false,
"stacking": {
"group": "A",
"mode": "none"
},
"thresholdsStyle": {
"mode": "off"
}
},
"mappings": [],
"thresholds": {
"mode": "absolute",
"steps": [
{
"color": "green",
"value": 0
},
{
"color": "red",
"value": 80
}
]
}
},
"overrides": []
},
"gridPos": {
"h": 8,
"w": 12,
"x": 0,
"y": 16
},
"id": 6,
"options": {
"legend": {
"calcs": [],
"displayMode": "list",
"placement": "bottom",
"showLegend": true
},
"tooltip": {
"hideZeros": false,
"mode": "single",
"sort": "none"
}
},
"pluginVersion": "12.4.1",
"targets": [
{
"datasource": {
"type": "prometheus",
"uid": "prometheus"
},
"editorMode": "code",
"expr": "sum without (__name__,job,http_flavor,http_scheme) (http_server_active_requests)",
"instant": false,
"legendFormat": "__auto",
"range": true,
"refId": "A"
}
],
"title": "活跃的HTTP请求数",
"type": "timeseries"
},
{
"datasource": {
"type": "prometheus",
"uid": "prometheus"
},
"fieldConfig": {
"defaults": {
"color": {
"mode": "palette-classic"
},
"custom": {
"axisBorderShow": false,
"axisCenteredZero": false,
"axisColorMode": "text",
"axisLabel": "",
"axisPlacement": "auto",
"barAlignment": 0,
"barWidthFactor": 0.6,
"drawStyle": "line",
"fillOpacity": 0,
"gradientMode": "none",
"hideFrom": {
"legend": false,
"tooltip": false,
"viz": false
},
"insertNulls": false,
"lineInterpolation": "linear",
"lineWidth": 1,
"pointSize": 5,
"scaleDistribution": {
"type": "linear"
},
"showPoints": "auto",
"showValues": false,
"spanNulls": false,
"stacking": {
"group": "A",
"mode": "none"
},
"thresholdsStyle": {
"mode": "off"
}
},
"mappings": [],
"thresholds": {
"mode": "absolute",
"steps": [
{
"color": "green",
"value": 0
},
{
"color": "red",
"value": 80
}
]
}
},
"overrides": []
},
"gridPos": {
"h": 8,
"w": 12,
"x": 12,
"y": 16
},
"id": 4,
"options": {
"legend": {
"calcs": [],
"displayMode": "list",
"placement": "bottom",
"showLegend": true
},
"tooltip": {
"hideZeros": false,
"mode": "single",
"sort": "none"
}
},
"pluginVersion": "12.4.1",
"targets": [
{
"datasource": {
"type": "prometheus",
"uid": "prometheus"
},
"editorMode": "code",
"expr": "avg without (__name__,job) (\r\n db_client_connections_usage\r\n)\r\n",
"instant": false,
"legendFormat": "__auto",
"range": true,
"refId": "A"
}
],
"title": "DB连接数",
"type": "timeseries"
},
{
"datasource": {
"type": "tempo",
"uid": "tempo"
},
"fieldConfig": {
"defaults": {},
"overrides": []
},
"gridPos": {
"h": 8,
"w": 12,
"x": 0,
"y": 24
},
"id": 7,
"options": {
"edges": {},
"layoutAlgorithm": "layered",
"nodes": {},
"zoomMode": "cooperative"
},
"pluginVersion": "12.4.1",
"targets": [
{
"datasource": {
"type": "tempo",
"uid": "tempo"
},
"key": "Q-00d81243-72c6-4f8c-b817-2f3b91dacad4-0",
"limit": 20,
"metricsQueryType": "range",
"queryType": "serviceMap",
"refId": "A",
"serviceMapUseNativeHistograms": false,
"tableType": "traces"
}
],
"title": "服务调用图",
"type": "nodeGraph"
},
{
"datasource": {
"type": "tempo",
"uid": "tempo"
},
"fieldConfig": {
"defaults": {
"custom": {
"align": "auto",
"cellOptions": {
"type": "auto"
},
"footer": {
"reducers": []
},
"inspect": false
},
"mappings": [],
"thresholds": {
"mode": "absolute",
"steps": [
{
"color": "green",
"value": 0
},
{
"color": "red",
"value": 80
}
]
}
},
"overrides": []
},
"gridPos": {
"h": 8,
"w": 12,
"x": 12,
"y": 24
},
"id": 8,
"options": {
"cellHeight": "sm",
"showHeader": true
},
"pluginVersion": "12.4.1",
"targets": [
{
"datasource": {
"type": "tempo",
"uid": "tempo"
},
"filters": [
{
"id": "0d6f56a3",
"operator": "=",
"scope": "span"
}
],
"limit": 20,
"metricsQueryType": "range",
"queryType": "traceqlSearch",
"refId": "A",
"serviceMapUseNativeHistograms": false,
"tableType": "traces"
}
],
"title": "Traces",
"type": "table"
}
],
"preload": false,
"schemaVersion": 42,
"tags": [],
"templating": {
"list": []
},
"time": {
"from": "now-1h",
"to": "now"
},
"timepicker": {},
"timezone": "browser",
"title": "Python Dashboard",
"uid": "admnssk",
"version": 20,
"weekStart": ""
}5. 总结
本文介绍了使用OpenTelemetry零代码插桩方式监控Python应用的方法。主要内容包括:1)快速部署基于Docker的Grafana LGTM作为监控后端;2)通过安装opentelemetry-distro包和自动插桩工具,实现Python应用的自动监控;3)配置环境变量并使用opentelemetry-instrument启动应用;4)展示了包含吞吐量、延迟时间、服务调用关系等关键指标的Grafana仪表板。该方法无需修改代码即可实现Python应用的全面监控,适合中小型系统快速搭建监控体系。

一站式 AI 云服务平台
更多推荐


 12
12 0
0- 0


 已为社区贡献1条内容

所有评论(0)